


6 Automatic Performance Diagnostics
This chapter describes Oracle Database automatic features for performance diagnosing and tuning.
这章描述oracle自动性能诊断和调优特性(其实也就是ADDM了),包括如下几点:
This chapter contains the following topics: ADDM概要
设置ADDM
使用ADDM进行诊断
显示ADDM诊断信息
6.1 Overview of the Automatic Database Diagnostic Monitor
When problems occur with a system, it is important to perform accurate and timely diagnosis of the problem before making any changes to a system. Oftentimes, a database administrator (DBA) simply looks at the symptoms and immediately starts changing the system to fix those symptoms. However, an accurate diagnosis of the actual problem in the initial stage significantly increases the probability of success in resolving the problem.
With Oracle Database, the statistical data needed for accurate diagnosis of a problem is stored in the Automatic Workload Repository (AWR). The Automatic Database Diagnostic Monitor (ADDM):
当系统发生问题时,在做出系统改变时,迅速而准确的确定问题所在是非常重要的。很多时候,DBA简单的看一下症状就立即开始修复这些症状。然而从一开始就准确地诊断实际的问题所在会增加解决问题的成功率。
在oracle数据库中,诊断问题需要的统计数据是存储在AWR中的。自动数据库诊断监控(ADDM): Analyzes the AWR data on a regular basis常规性的对AWR数据进行分析
Diagnoses the root causes of performance problems诊断性能问题的根本原因
Provides recommendations for correcting any problems提供解决问题的建议
Identifies non-problem areas of the system确定非问题区
Because AWR is a repository of historical performance data, ADDM can analyze performance issues after the event, often saving time and resources in reproducing a problem.
因为AWR是一个历史性能数据的仓库,ADDM可以从事件一发生就开始分析性能问题,这样就节约时间和资源去重新产生这个问题(不需要去重新跑数据以产生这个问题或者进行数据重演了)。
In most cases, ADDM output should be the first place that a DBA looks when notified of a performance problem. ADDM provides the following benefits:
多数情况下,当发现一个性能问题时,DBA应该首先去看看ADDM。ADDM包含了以下的好处: Automatic performance diagnostic report every hour by default【默认情况下每小时产生一次性能诊断的报告】
Problem diagnosis based on decades of tuning expertise【基于10多年的调优经验去诊断问题,即ADDM是非常聪明的】
Time-based quantification of problem impacts and recommendation benefits【问题影响及建议益处是基于量化的时间】
Identification of root cause, not symptoms【确定根本的原因,而不仅仅是表象】
Recommendations for treating the root causes of problems【提供解决这些根本原因的建议】
Identification of non-problem areas of the system【确定系统中的非问题区域】
Minimal overhead to the system during the diagnostic process【在诊断过程中不对系统造成大的影响,仅仅以小的负荷运行】
It is important to realize that tuning is an iterative process, and fixing one problem can cause the bottleneck to shift to another part of the system. Even with the benefit of ADDM analysis, it can take multiple tuning cycles to reach acceptable system performance. ADDM benefits apply beyond production systems; on development and test systems, ADDM can provide an early warning of performance issues.
请注意调优是一个迭代的过程,修复一个问题可能将瓶颈又转移到其他部分。甚至根据ADDM的分析,也需要多次的调优才能达到可接受的系统性能。ADDM的好处不仅仅是在生产系统;在开发和测试环境中,ADDM也能尽早的发现问题。
This section contains the following topics:
6.1.1 ADDM Analysis
An ADDM analysis can be performed on a pair of AWR snapshots and a set of instances from the same database. The pair of AWR snapshots define the time period for analysis, and the set of instances define the target for analysis.
ADDM分析可以执行在一对AWR快照上,以及一系列相同数据库的实例上(RAC是同库多实例的)。一对AWR快照定义了分析的时间周期,实例集定义了分析要分析的目标物。
If you are using Oracle Real Application Clusters (Oracle RAC), ADDM has three analysis modes:假如你使用RAC的话,ADDM有3个分析模式: Database数据库
In Database mode, ADDM analyzes all instances of the database.在数据库层面上,ADDM分析所有的实例 Instance实例
In Instance mode, ADDM analyzes a particular instance of the database.在实例层面上,ADDM分析数据库中特定的实例 Partial部分
In Partial mode, ADDM analyzes a subset of all database instances.在这种层面上,ADDM分析数据库所有实例的一部分,即个别实例
If you are not using Oracle RAC, ADDM can only function in Instance mode because there is only one instance of the database.
An ADDM analysis is performed each time an AWR snapshot is taken and the results are saved in the database. The time period analyzed by ADDM is defined by the last two snapshots (the last hour by default). ADDM will always analyze the specified instance in Instance mode. For non-Oracle RAC or single instance environments, the analysis performed in the Instance mode is the same as a database-wide analysis. If you are using Oracle RAC, ADDM will also analyze the entire database in Database mode. After an ADDM completes its analysis, you can view the results using Oracle Enterprise Manager, or by viewing a report in a SQL*Plus session.
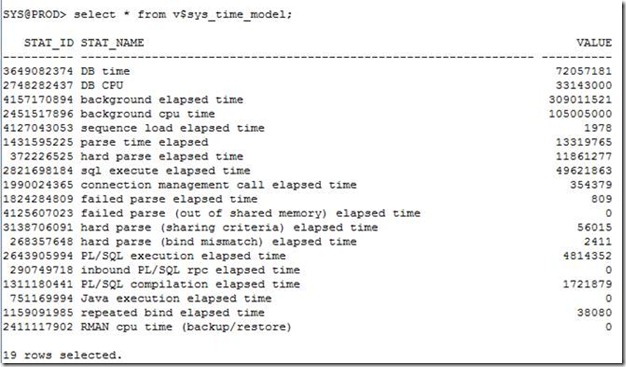
ADDM analysis is performed top down, first identifying symptoms, and then refining them to reach the root causes of performance problems. The goal of the analysis is to reduce a single throughput metric called DB time. DB time is the cumulative time spent by the database in processing user requests. It includes wait time and CPU time of all non-idle user sessions. DB time is displayed in the V$SESS_TIME_MODEL and V$SYS_TIME_MODEL views.
By reducing DB time, the database is able to support more user requests using the same resources, which increases throughput. The problems reported by ADDM are sorted by the amount of DB time they are responsible for. System areas that are not responsible for a significant portion of DB time are reported as non-problem areas.
假如你没有使用RAC, ADDM只能工作在实例模式下,因为只有一个实例可以使用。
ADDM每次分析一个AWR快照,并且把结果存储到数据库中。ADDM分析的时间周期被定义成过去的2个快照(也就是过去的1小时了,这是默认的)。ADDM总是在实例模式下分析指定的实例。对于非RAC或者单实例环境下,在实例模式下的分析与数据库级别分析是一样的。假如你使用RAC,ADDM将会在数据库模式下分析整个数据库。ADDM分析完之后,你就可以使用OEM去看结果了,或者使用SQL*PLUS去查看。
ADDM是从上到下进行分析的,首先确定症状,然后提炼症状,以找出系统性能的根本原因。分析的目标是减少单个吞吐量度量值(DB TIME)。db time是数据库花费在用户请求上的累积时间。它包括了等待时间和非空闲的用户会话占用的CPU时间。这个时间存储在:v$sess_time_model , v$sys_time_model视图中。
通过减少DB TIME, 数据库将能够在现有的资源上支持更多的用户请求,这样就增加了吞吐量。ADDM报告的内容是按照DB TIME占用的多少进行排序的。未造成显著DB TIME的系统区问题,将被放到非问题区中展示。
The types of problems that ADDM considers include the following:ADDM在分析时会考虑以下的问题:
注:
因为ADDM毕竟是程序,只要是程序,那就一定是按照某个规则去运算的,那ADDM是怎样去发现问题的呢?
首先它先去看DB TIME占比有多大,如果比较大就说明有问题;这个很显然如果空闲的话就不用去分析了(但是我觉得既然空闲更应该去看看发生了什么,看看还有没有什么可以提升的)
接下来按什么规则或者按什么条件去分析呢?下面就是它评估系统是否有问题的几个方面,如果这几类有问题它就开始统计了 CPU bottlenecks - Is the system CPU bound by Oracle Database or some other application?
CPU的瓶颈–是数据库造成CPU高还是其他程序? Undersized Memory Structures - Are the Oracle Database memory structures, such as the SGA, PGA, and buffer cache, adequately sized?
内存太小–是否数据库的内存结构如SGA,PGA,buffer cache不够? I/O capacity issues - Is the I/O subsystem performing as expected?
IO容量问题–是否IO子系统按期望的运行?(DBIO_EXPECTED) High load SQL statements - Are there any SQL statements which are consuming excessive system resources?
SQL高负荷–是否有SQL消耗大量系统资源? High load PL/SQL execution and compilation, and high-load Java usage
PL/SQL,编译,JAVA造成高负荷 Oracle RAC specific issues - What are the global cache hot blocks and objects; are there any interconnect latency issues?
RAC特殊问题–什么是全局的缓存热块和对象;是不是有什么内部连接延迟问题? Sub-optimal use of Oracle Database by the application - Are there problems with poor connection management, excessive parsing, or application level lock contention?
应用程序不合理的使用数据库–是否有比较差的数据库连接问题,过多的解析,或者应用级别的锁竞争问题? Database configuration issues - Is there evidence of incorrect sizing of log files, archiving issues, excessive checkpoints, or sub-optimal parameter settings?
数据库配置问题–是否有证据表明不正确的日志文件大小,归档问题,过多的checkpoints,或者未最优的参数设置? Concurrency issues - Are there buffer busy problems?
并发问题–是否有buffer busy问题? Hot objects and top SQL for various problem areas
各种问题区的热对象和top sql
Note:注意,这不是一个ADDM要考虑和分析的所有问题的综合列表
This is not a comprehensive list of all problem types that ADDM considers in its analysis.
ADDM also documents the non-problem areas of the system. For example, wait event classes that are not significantly impacting the performance of the system are identified and removed from the tuning consideration at an early stage, saving time and effort that would be spent on items that do not impact overall system performance.
ADDM同样会记录系统的非问题区域。比如,未明显影响系统的等待事件类被确认后,就从早期的调优策略中移除掉,这样就节约了时间和精力去做没有太多帮助的性能优化(不要把精力放在没有太大意义的优化上)。
如果你看到了这里,说明还真是有耐心,那么请直接跳到最后去看一下实验,然后再回到这里往下看。看完实验后看下面就非常容易了!
6.1.2 Using ADDM with Oracle Real Application Clusters
If you are using Oracle RAC, you can run ADDM in Database analysis mode to analyze the throughput performance of all instances of the database. In Database mode, ADDM considers DB time as the sum of the database time for all database instances. Using the Database analysis mode enables you to view all findings that are significant to the entire database in a single report, instead of reviewing a separate report for each instance.
The Database mode report includes findings about database resources (such as I/O and interconnect). The report also aggregates findings from the various instances if they are significant to the entire database. For example, if the CPU load on a single instance is high enough to affect the entire database, the finding will appear in the Database mode analysis, which will point to the particular instance responsible for the problem.
假如你使用了RAC, 你可以在数据库分析模式下运行ADDM,以便分析出整个数据库的所有实例的吞吐量性能问题。在数据库模式下,ADDM将把所有实例的DB TIME作为一个整体进行统计。使用数据库分析模式将使你能够在单一的报表中,看到影响整个数据库的“发现”(findings,可以理解成发现的问题),而不是每个实例的一部分内容。
数据库模式报告包括了数据库资源的findings,例如IO和互联。报表同时会将影响整个数据库的findings汇总起来展示。例如,假如一个单实例上的CPU负荷非常的高,影响到了整个数据库,那么这个问题就会出现在数据库模式的分析中,它将报告出这个特殊实例的问题原因。
6.1.3 ADDM Analysis Results
In addition to problem diagnostics, ADDM recommends possible solutions. ADDM analysis results are represented as a set of findings. See Example 6-1 for an example of ADDM analysis result. Each ADDM finding can belong to one of the following types:
除了诊断问题,ADDM会提出一些可能的解决建议。ADDM的分析结果通过一系列的findings一起展示出来。每个ADDM finding可能包含以下几个类型之一: Problem findingsdescribe the root cause of a database performance problem.
“问题发现”描述了影响性能的根本原因;即描述信息 Symptom findingscontain information that often lead to one or more problem findings.
“症状发现”包含导致一个或多问题的相关信息 Information findingsare used for reporting information that are relevant to understanding the performance of the database, but do not constitute a performance problem (such as non-problem areas of the database and the activity of automatic database maintenance).
“信息发现”用于报告有助于理解的相关的数据库性能的报告信息,但是它们没有构成一个性能问题(比如一个非问题区和自动数据库维护的活动) Warning findingscontain information about problems that may affect the completeness or accuracy of the ADDM analysis (such as missing data in the AWR).
“警告发现”包含那些影响ADDM分析的完整性与准确性的信息(例如AWR数据中少一些数据)
Each problem finding is quantified by an impact that is an estimate of the portion of DB time caused by the finding's performance issue. A problem finding can be associated with a list of recommendations for reducing the impact of the performance problem. The types of recommendations include:
每个问题都是按照占用DB TIME的部分进行量化统计的。每个“问题发现”都有一系列的建议以降低这个性能问题,建议包括了如下: Hardware changes: adding CPUs or changing the I/O subsystem configuration
硬件资源不够,需要增加CPU或者IO Database configuration: changing initialization parameter settings
系统配置有问题 Schema changes: hash partitioning a table or index, or using automatic segment-space management (ASSM)
使用hash去将表或索引进行分区,或者使用ASSM Application changes: using the cache option for sequences or using bind variables
将sequence进行一定的缓存,或者使用绑定变量 Using other advisors: running SQL Tuning Advisor on high-load SQL or running the Segment Advisor on hot objects
使用sql tuning advisor去分析一下TOP SQL或者使用segment advisor分析一下热对象
A list of recommendations can contain various alternatives for solving the same problem; you do not have to apply all the recommendations to solve a specific problem. Each recommendation has a benefit which is an estimate of the portion of DB time that can be saved if the recommendation is implemented. Recommendations are composed of actions and . You must apply all the actions of a recommendation to gain the estimated benefit. The rationales are used for explaining why the set of actions were recommended and to provide additional information to implement the suggested recommendation.
一系列的建议可能包含各种不同的解决相同问题的方式;你不一定要使用所有的建议去解决一个特定的问题。每种建议都有一个可以节约db time的好处。建议是由actioon和rationale(原理)组成的。你必须应用所有的action以达到评估的那种益处。rationale被用作解释为什么这一系列的action被建议出来,并且提供额外的信息去实现建议。
6.1.4 Reviewing ADDM Analysis Results: Example
Consider the following section of an ADDM report in Example 6-1.
Example 6-1 Example ADDM Report
FINDING1: 31% impact (7798 seconds)
------------------------------------
SQL statements were not shared due to the usage of literals. This resulted in
additional hard parses which were consuming significant database time.
RECOMMENDATION 1: Application Analysis, 31% benefit (7798 seconds)
ACTION: Investigate application logic for possible use of bind variables
instead of literals. Alternatively, you may set the parameter
"cursor_sharing" to "force".
RATIONALE: SQL statements with PLAN_HASH_VALUE 3106087033 were found to be
using literals. Look in V$SQL for examples of such SQL statements.
In Example 6-1, the finding points to a particular root cause, the usage of literals in SQL statements, which is estimated to have an impact of about 31% of total DB time in the analysis period.
The finding has a recommendation associated with it, composed of one action and one rationale. The action specifies a solution to the problem found and is estimated to have a maximum benefit of up to 31% DB time in the analysis period. Note that the benefit is given as a portion of the total DB time and not as a portion of the finding's impact. The rationale provides additional information on tracking potential SQL statements that were using literals and causing this performance issue. Using the specified plan hash value of SQL statements that could be a problem, a DBA could quickly examine a few sample statements.
When a specific problem has multiple causes, the ADDM may report multiple problem and symptom findings. In this case, the impacts of these multiple findings can contain the same portion of DB time. Because the performance issues of findings can overlap, the sum of the impacts of the findings can exceed 100% of DB time. For example, if a system performs many reads, then ADDM might report a SQL statement responsible for 50% of DB time due to I/O activity as one finding, and an undersized buffer cache responsible for 75% of DB time as another finding.
When multiple recommendations are associated with a problem finding, the recommendations may contain alternatives for solving the problem. In this case, the sum of the recommendations' benefits may be higher than the finding's impact.
When appropriate, an ADDM action may have multiple solutions for you to choose from. In the example, the most effective solution is to use bind variables. However, it is often difficult to modify the application. Changing the value of the CURSOR_SHARING initialization parameter is much easier to implement and can provide significant improvement.
这这个例子中,finding指向一个特别的根本性原因------就是在SQL语句中使用字面值------这样在这个分析周期里评估下来,对DB TIME有31%的影响。
这个finding有一个由action和rationale组成的建议。action指定了一个解决问题的方法,以及在分析周期里评估有31%的DB TIME提升。注意,这个benefit是指总的DB TIME中所占的部分,而不是所有findings影响中占据的部分。rationale在跟踪潜在的,使用字面值以及造成性能问题的SQL语句上提供额外的信息。使用这个SQL的plan hash value,DBA可以快速的检查一些采样的语句。
当一个特有的问题有许多的原因,ADDM可能报告多个问题和症状findings。 在这种情况下,这些findings的影响可能包含相同的DB TIME占比。因为这些finding性能问题可能重叠,总的finding影响可能会超过100%的DB TIME。例如,一个系统执行许多读操作,那么ADDM可能报告一个SQL语句作为一个finding因使用IO活跃性占用50%的DB TIME,并且另一个finding因为buffer cache不足占用75%的DB TIME。
当多个建议关联到一个finding问题上,建议就包含了不同的解决问题的办法。在这种情况下,总的建议的好处可能高于finding的影响。
当可能的话,addm action可能有多个解决方案。在这个例子中,是有效的办法是使用绑定变量。然而,有时去修改应用程序是非常困难的。改变cursor_sharing这个参数则是非常容易的,并且能够提供足够的提升。
6.2 Setting Up ADDM
Automatic database diagnostic monitoring is enabled by default and is controlled by the CONTROL_MANAGEMENT_PACK_ACCESS and the STATISTICS_LEVEL initialization parameters.
The CONTROL_MANAGEMENT_PACK_ACCESS parameter should be set to DIAGNOSTIC or DIAGNOSTIC+TUNING to enable automatic database diagnostic monitoring. The default setting is DIAGNOSTIC+TUNING. Setting CONTROL_MANAGEMENT_PACK_ACCESS to NONE disables ADDM.
The STATISTICS_LEVEL parameter should be set to the TYPICAL or ALL to enable automatic database diagnostic monitoring. The default setting is TYPICAL. Setting STATISTICS_LEVEL to BASIC disables many Oracle Database features, including ADDM, and is strongly discouraged.
ADDM analysis of I/O performance partially depends on a single argument, DBIO_EXPECTED, that describes the expected performance of the I/O subsystem. The value of DBIO_EXPECTED is the average time it takes to read a single database block in microseconds. Oracle Database uses the default value of 10 milliseconds, which is an appropriate value for most modern hard drives. If your hardware is significantly different, such as very old hardware or very fast RAM disks, consider using a different value.
ADDM默认是打开的,它是由control_management_pack_access和statistics_level参数决定的
control_management_pack_access参数应该设置成diagnostic或者diagnostic+tunning(默认值)以便打开ADDM功能。将值设置成NONE将禁用ADDM。
statistics_level参数应该设置成typical或者all以便打开ADDM。默认值是TYPICAL。设置成BASIC将取消许多数据库特性,包括ADDM,因此是不建议取消的。
ADDM关于IO性能的分析部分地依赖于一个变量:DBIO_EXPECTED,它是期望的IO子系统性能。这个值是读取一个数据库块所用的微秒数。oracle数据库的默认值是10毫秒,这个值对于现代的系统而言是比较合适的。假如你的系统非常的不同,例如使用了非常旧的硬件或者非常快的内存磁盘,考虑使用不同的值。(在我自己的SSD硬盘上,随机读取8K大概是0.2毫秒左右,也就是200微秒;当然在虚拟机上又是非常的慢)
To determine the correct setting for DBIO_EXPECTED parameter:判断DBIO_EXPECTED参数的正确设置: Measure the average read time of a single database block read for your hardware. Note that this measurement is for random I/O, which includes seek time if you use standard hard drives. Typical values for hard drives are between 5000 and 20000 microseconds.测量系统中单数据库块读的响应时间(单块一般是8K)。注意这个测量是要随机的IO读取,包括了寻道时间。通常这个值是5000到20000微秒(5毫秒到20毫秒)。
Set the value one time for all subsequent ADDM executions. For example, if the measured value if 8000 microseconds, you should execute the following command as SYS user:一次性的设置DBIO_EXPETED用于所有的后续ADDM执行。比如,假如这个测量值是8000微秒(8毫秒),你应该以SYS用户的身份去执行
EXECUTE DBMS_ADVISOR.SET_DEFAULT_TASK_PARAMETER('ADDM', 'DBIO_EXPECTED', 8000);
6.3 Diagnosing Database Performance Problems with ADDM
To diagnose database performance problems, first review the ADDM analysis results that are automatically created each time an AWR snapshot is taken. If a different analysis is required (such as a longer analysis period, using a different DBIO_EXPECTED setting, or changing the analysis mode), you can run ADDM manually as described in this section.
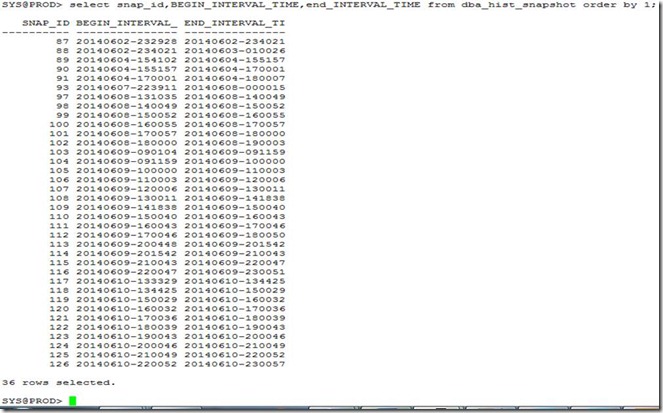
ADDM can analyze any two AWR snapshots (on the same database), as long as both snapshots are still stored in the AWR (have not been purged). ADDM can only analyze instances that are started before the beginning snapshot and remain running until the ending snapshot. Additionally, ADDM will not analyze instances that experience significant errors when generating the AWR snapshots. In such cases, ADDM will analyze the largest subset of instances that did not experience these problems.
The primary interface for diagnostic monitoring is Oracle Enterprise Manager. Whenever possible, you should run ADDM using Oracle Enterprise Manager. If Oracle Enterprise Manager is unavailable, you can run ADDM using the DBMS_ADDM package. In order to run the DBMS_ADDM APIs, the user must be granted the ADVISOR privilege.
为了诊断数据库性能问题,首先去分析一下ADDM的分析结果,它是在AWR快照产生时自动产生的。假如需要一个不同的分析(例如需要一个长时间的周期,使用不同的DBIO_EXPECTED或者改变分析的模式),你就应该手动的运行ADDM。
ADDM可以分析任何在相同数据库上的2个AWR快照,只要这两个快照都存储在AWR中尚未被删除掉就行。ADDM只能分析在数据库实例启动以后的,在运行期内产生的快照,也就是说一旦有两个快照是跨越了数据库重启,则无法进行分析了。另外ADDM无法去分析那些在产生AWR快照时出现明显错误的实例。在这种情况下,ADDM将会分析最大的未发生错误的实例子集。
分析ADDM主要靠OEM,如果没有安装OEM,那就使用DBMS_ADDM包去分析。必须有ADVISOR的权限才能调用DBMS_ADDM接口。
This section contains the following topics:
6.3.1 Running ADDM in Database Mode
For Oracle RAC configurations, you can run ADDM in Database mode to analyze all instances of the databases. For single-instance configurations, you can still run ADDM in Database mode; ADDM will simply behave as if running in Instance mode.
对于RAC配置,你可以运行ADDM在数据库模式下去分析数据库的所有实例。对于单实例配置而言,你也可以运行在数据库模式下;ADDM则像运行在实例模式下去运行。
为了运行数据库模式,使用 dbms_addm.analyze_db存储过程:
To run ADDM in Database mode, use the DBMS_ADDM.ANALYZE_DB procedure:
BEGIN
DBMS_ADDM.ANALYZE_DB (
task_nameIN OUT VARCHAR2,
begin_snapshotINNUMBER,
end_snapshotINNUMBER,
db_idINNUMBER := NULL);
END;
/
The task_name parameter specifies the name of the analysis task that will be created. The begin_snapshot parameter specifies the snapshot number of the beginning snapshot in the analysis period. The end_snapshot parameter specifies the snapshot number of the ending snapshot in the analysis period. The db_id parameter specifies the database identifier of the database that will be analyzed. If unspecified, this parameter defaults to the database identifier of the database to which you are currently connected.
The following example creates an ADDM task in database analysis mode, and executes it to diagnose the performance of the entire database during the time period defined by snapshots 137 and 145:
task_name是被创建的分析任务的名称(注意这个参数是IN OUT类型,所以要使用变量)。begin_shnapshot参数指定了分析周期的开始快照。end_snapshot指定了结束的快照。db_id不指定的话,默认是你现在连接的数据库。
下面的例子在数据库分析模式下创建一个任务,执行它去诊断整个数据库的性能问题,分析周期是从快照的137到145之间(相当于7个小时内的数据分析)
BEGIN
:tname := 'ADDM for 7PM to 9PM';
DBMS_ADDM.ANALYZE_DB(:tname, 137, 145);
END;
/
6.3.2 Running ADDM in Instance Mode
To analyze a particular instance of the database, you can run ADDM in Instance mode. To run ADDM in Instance mode, use the DBMS_ADDM.ANALYZE_INST procedure:
这个实例模式与数据库模式除了名称不一样,其他的基本一样,使用dbms_addm.analyze_inst存储过程实现。
BEGIN
DBMS_ADDM.ANALYZE_INST (
task_nameIN OUT VARCHAR2,
begin_snapshotINNUMBER,
end_snapshotINNUMBER,
instance_numberINNUMBER := NULL,
db_idINNUMBER := NULL);
END;
/
The task_name parameter specifies the name of the analysis task that will be created. The begin_snapshot parameter specifies the snapshot number of the beginning snapshot in the analysis period. The end_snapshot parameter specifies the snapshot number of the ending snapshot in the analysis period. The instance_number parameter specifies the instance number of the instance that will be analyzed. If unspecified, this parameter defaults to the instance number of the instance to which you are currently connected. The db_id parameter specifies the database identifier of the database that will be analyzed. If unspecified, this parameter defaults to the database identifier of the database to which you are currently connected.
The following example creates an ADDM task in instance analysis mode, and executes it to diagnose the performance of instance number 1 during the time period defined by snapshots 137 and 145:
上面的废话都是在解释这个analyze_partial存储过程的几个参数,不用去看了,一眼就看懂了,不是嘛!
VAR tname VARCHAR2(30);
BEGIN
:tname := 'my ADDM for 7PM to 9PM';
DBMS_ADDM.ANALYZE_INST(:tname, 137, 145, 1);
END;
/
6.3.3 Running ADDM in Partial Mode
To analyze a subset of all database instances, you can run ADDM in Partial mode. To run ADDM in Partial mode, use the DBMS_ADDM.ANALYZE_PARTIAL procedure:
BEGIN
DBMS_ADDM.ANALYZE_PARTIAL (
task_nameIN OUT VARCHAR2,
instance_numbersINVARCHAR2,这个是和数据库模式下比多出来的,数据库模式是所有的实例,而它可以指定某几个实例
begin_snapshotINNUMBER,
end_snapshotINNUMBER,
db_idINNUMBER := NULL);
END;
/
The task_name parameter specifies the name of the analysis task that will be created. The instance_numbers parameter specifies a comma-delimited list of instance numbers of instances that will be analyzed. The begin_snapshot parameter specifies the snapshot number of the beginning snapshot in the analysis period. The end_snapshot parameter specifies the snapshot number of the ending snapshot in the analysis period. The db_id parameter specifies the database identifier of the database that will be analyzed. If unspecified, this parameter defaults to the database identifier of the database to which you are currently connected.
The following example creates an ADDM task in partial analysis mode, and executes it to diagnose the performance of instance numbers 1, 2, and 4, during the time period defined by snapshots 137 and 145:
VAR tname VARCHAR2(30);
BEGIN
:tname := 'my ADDM for 7PM to 9PM';
DBMS_ADDM.ANALYZE_PARTIAL(:tname, '1,2,4', 137, 145);
END;
/
6.3.4 Displaying an ADDM Report
To display a text report of an executed ADDM task, use the DBMS_ADDM.GET_REPORT function:
DBMS_ADDM.GET_REPORT (task_nameIN VARCHAR2
RETURN CLOB);
The following example displays a text report of the ADDM task specified by its task name using the tname variable:
;
Note that the return type of a report is a CLOB, formatted to fit line size of 80..
注意返回值是CLOB类型,被格式化成按80列对齐了。一定要注意设置set long xxxxxxxx,不然会显示不全的。:tname是一个刚才analyze_db时的名称。
如果想在文件中使用的话,可以使用spool xxx.txt;最后再加上spool off;就可以输出到文件了
6.4 Views with ADDM Information
Typically, you should view output and information from ADDM using Oracle Enterprise Manager or ADDM reports.
通常情况下你可以通过OEM或者ADDM报表去查看输出的结果和信息。
然而你也可以通过dba_advisor视图去查看这个信息。下面是一组相关的信息:
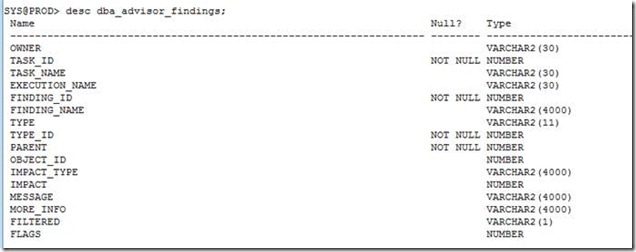
However, you can display ADDM information through the DBA_ADVISOR views. This group of views includes: DBA_ADVISOR_FINDINGS
This view displays all the findings discovered by all advisors. Each finding is displayed with an associated finding ID, name, and type. For tasks with multiple executions, the name of each task execution associated with each finding is also listed.
这个视图列出了所有的findings。每个finding都有一个finding id,name,type。 对于多个执行的任务,每个任务执行名称连同每个finding被列出来。
从视图的定义看,finding_name,finding_id, type,type_id,owner,task_name,task_id等等。很多是4000字节的,还是从报表中看吧!
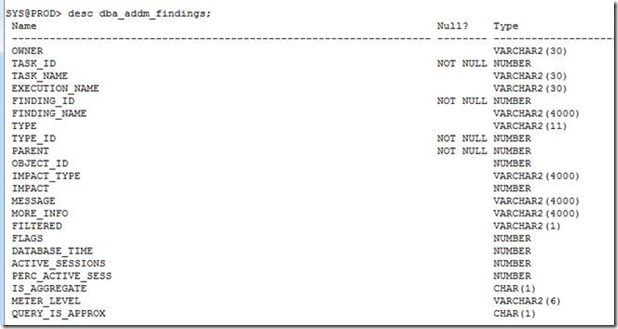
 DBA_ADDM_FINDINGS
This view contains a subset of the findings displayed in the related DBA_ADVISOR_FINDINGS view. This view only displays the ADDM findings discovered by all advisors. Each ADDM finding is displayed with an associated finding ID, name, and type.
 DBA_ADVISOR_FINDING_NAMES
List of all finding names registered with the advisor framework.
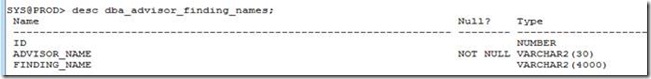
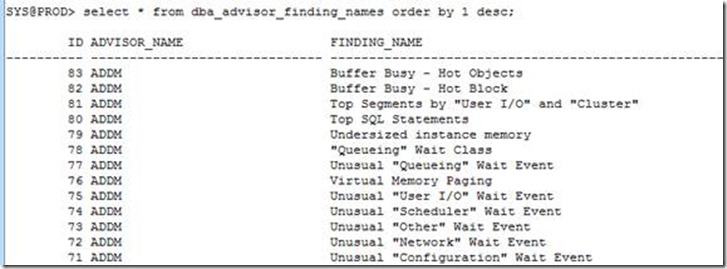
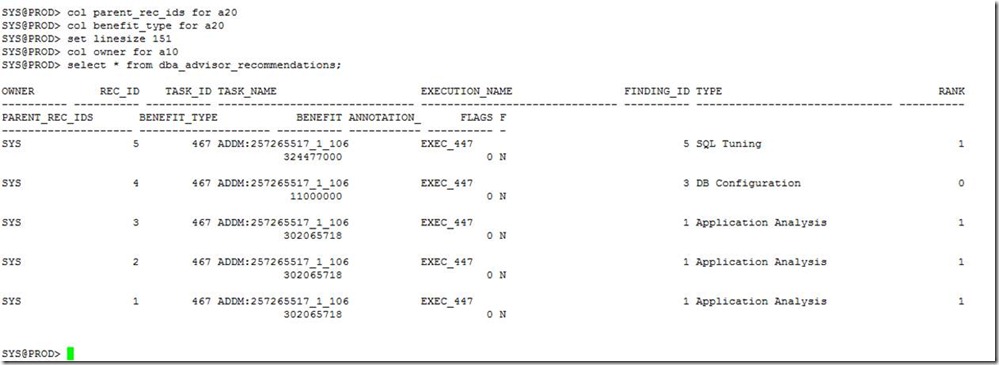
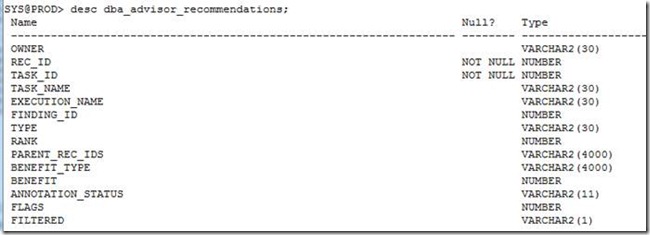
这里一共有83个finding项 DBA_ADVISOR_RECOMMENDATIONS
This view displays the results of completed diagnostic tasks with recommendations for the problems identified in each execution. The recommendations should be reviewed in the order of the RANK column, as this relays the magnitude of the problem for the recommendation. The BENEFIT column displays the benefit to the system you can expect after the recommendation is performed. For tasks with multiple executions, the name of each task execution associated with each advisor task is also listed.
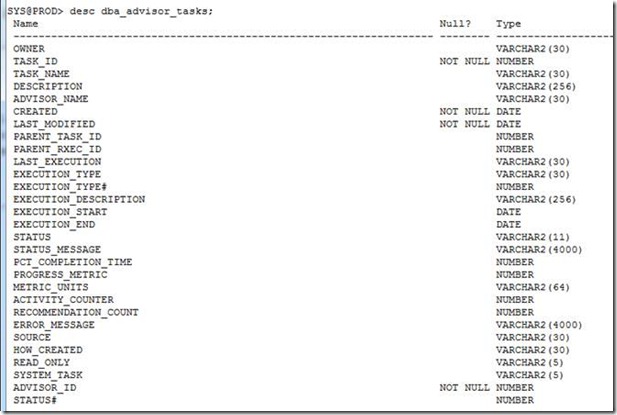
 DBA_ADVISOR_TASKS
This view provides basic information about existing tasks, such as the task ID, task name, and when the task was created. For tasks with multiple executions, the name and type of the last or current execution associated with each advisor task is also listed.
窗体顶端


 被折叠的 条评论
为什么被折叠?
被折叠的 条评论
为什么被折叠?
 到【灌水乐园】发言


