


You can circumvent this issue by doing the following:
1) Add a new transparent axes at the same position than the existing one.
2) Make its NextPlot property set to add.
3) Adjust its limits to fit with that of the axes generated by the candle plot.
So in code this looks like this:
clear all
clc
close all
load disney;
candle(dis_HIGH(end-20:end), dis_LOW(end-20:end), dis_CLOSE(end-20:end),...
dis_OPEN(end-20:end), 'b');
%//======================
%// Get current axes
Axes1 = gca;
%// Get the current limits
Axes1XLim = get(gca,'XLim');
Axes1YLim = get(gca,'YLim');
%// Create new axes
hold on
NewAxes = axes('Position',get(gca,'Position'),'Color','none','XTick',get(Axes1,'XTick'),'YTick',get(Axes1,'YTick'),'NextPlot','add')
%// Plot your data on new axes
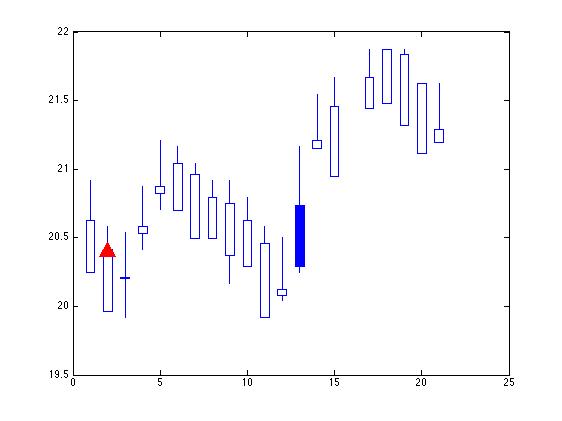
m = plot(NewAxes,2,20.4,'r^','MarkerFaceColor','r', 'MarkerSize',15);
%// Adjust its limits
xlim(Axes1XLim)
ylim(Axes1YLim)
And the output:


 被折叠的 条评论
为什么被折叠?
被折叠的 条评论
为什么被折叠?
 到【灌水乐园】发言


