


Overview
HTML5/JavaScript Sparkline Charts is a replacement for normal charts to display trends in a very small area. Customize sparklines completely by changing the series or axis type and by adding markers, data labels, range bands, and more.
Sparkline types
JavaScript Sparkline Charts support five types of sparklines (line, column, area, win-loss, and pie) to show data trends.
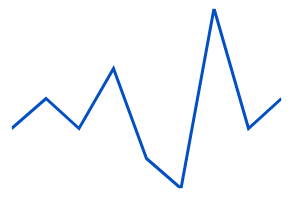
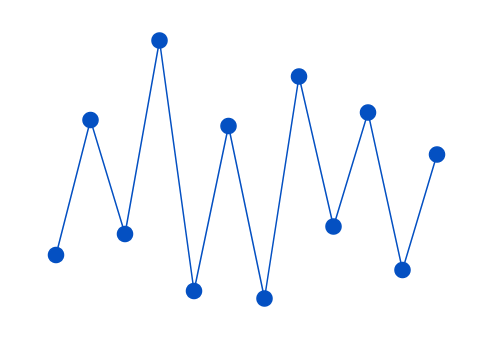
Line sparkline
Use a line sparkline to represent patterns and trends in data, such as seasonal effects, large changes, and turning points over a period of time.
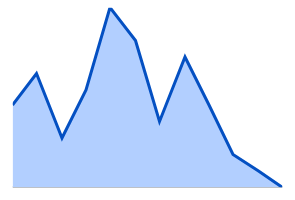
Area sparkline
An area sparkline is a line sparkline with the area between its points colored. Use this when the magnitude of the trend is to be communicated rather than individual data values.
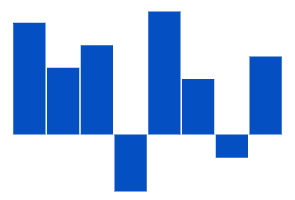
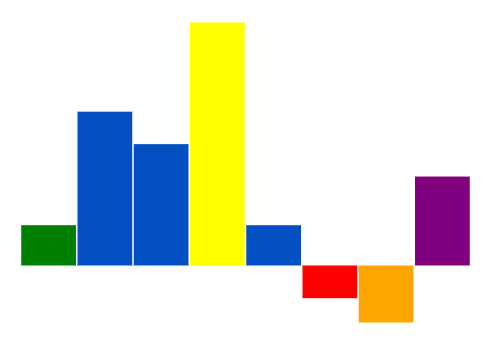
Column sparkline
A column sparkline is designed to show different values of two or more subjects. Use vertical bars to represent the different values.

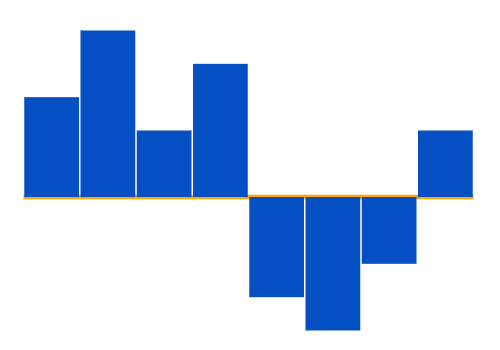
Win-loss sparkline
Use a win-loss sparkline to show if each value is positive, negative, or zero to visualize win/loss scenarios such as results in games.
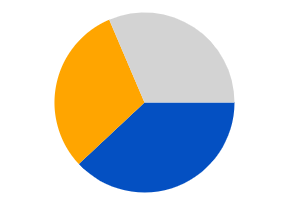
Pie sparkline
A pie sparkline is a circular graph that is divided into slices to illustrate numeric proportions.
Axis value types
JavaScript Sparkline Charts control offers different axes types like numeric, category, and date-time to plot any type of data in the sparkline.
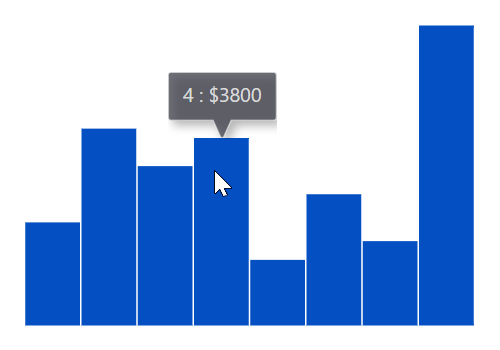
Sparkline with numeric values
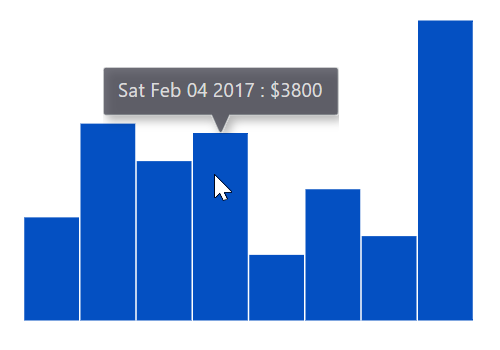
Sparkline with datetime values
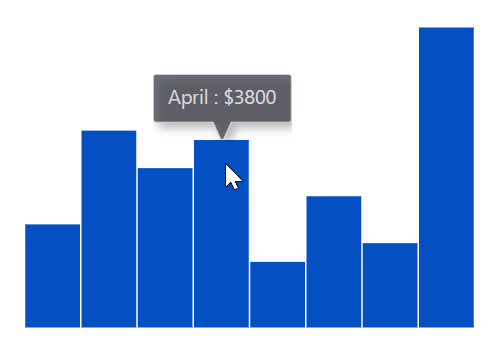
Sparkline with categorical values
Previous
Next
Axis customization
Configure and customize the axis in sparkline graphs to show the origin and range of the data points.
Special points customization
Denote the data usage in JavaScript sparkline charts by highlighting and customizing the special data points, such as first, last, high, low, and negative points.
Markers
The markers highlights data points in the line and area sparklines and makes these sparklines more readable.
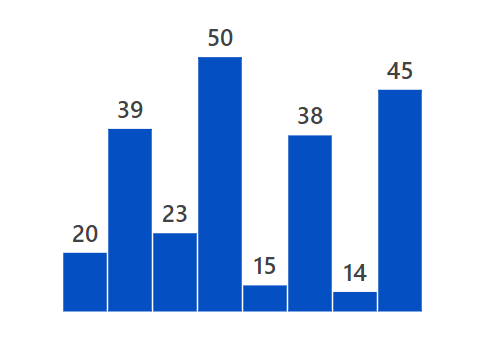
Data label
Improve readability by using data labels in the sparkline to display the values of data points.
Tooltip
The interactive JavaScript Sparkline Charts provide options to display details about data point values through a tooltip when hovering the mouse over a data point.
Track line
The track line tracks the data points that are closer to the mouse position or touch contact.
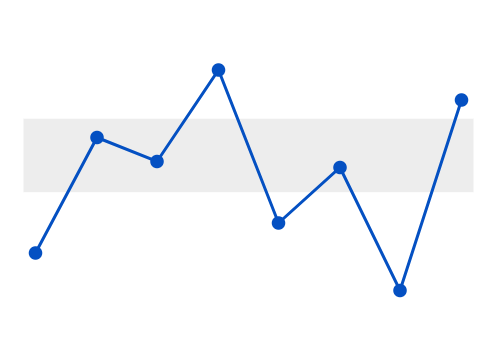
Range band
Highlight a particular region in a JavaScript sparkline charts using a range band to show the range of safe values. By setting the minimum and maximum ranges for a range band, the outliers can be easily identified.
Touch and browser support
The interactive Sparkline Chart control also supports touch interactions.

Touch support
All the sparkline features will work on touch devices with zero configuration. Use touch features such as tooltip and track line without any customization.

Responsive
You can view the JavaScript Sparkline Charts control on various devices. Also hide specific elements in the sparkline for particular screen sizes by making a very minimal change in the events.

Cross-browser support
You can render the Sparkline Charts component in all modern browsers.
Other supported frameworks
The Sparkline Charts component is also available in Blazor, React, Angular, and Vue frameworks. Check out the different Sparkline Charts platforms from the links below,


 384
384


 被折叠的 条评论
为什么被折叠?
被折叠的 条评论
为什么被折叠?
 到【灌水乐园】发言


