


profiling 是一项非常重要的,但又对很多程序员陌生的技术,它尤其对性能调优有显著帮助。本文以Brendan对perf的介绍稍加引入【底层涉及了太多细节,目前仅关心如何用它对服务器应用进行user-level性能分析
perf使用简单介绍
有几个主要的子命令
- list: 查看支持的事件
- stat: 对事件进行计数,可限定一定时间,可指定事件名
- record: 可指定sampling 频率、事件名、进程号等。它属于static tracing;会生成perf.data,有开销,频率越大,开销越大文件也越大;4.4内核支持用户编写BPF来嵌入,从而可以过滤数据以减少开销
- probe: 动态tracing
- report: 总结由record生成的perf.data数据,以human readable方式显示
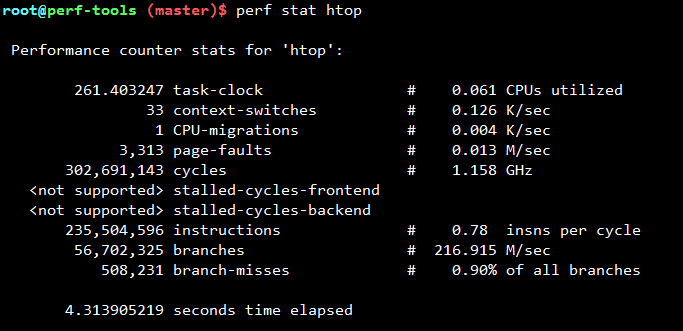
比如查看htop在CPU counter上的统计
perf stat htop
倘若需perf支持执行文件,编译不需添加-g参数,保证文件不是stripped就行,否则report时无法查看到符号,像下面这样,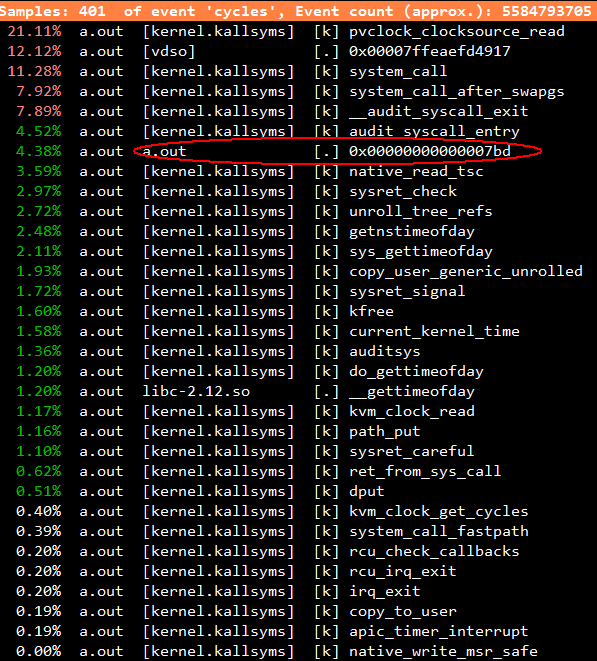
关于命令更多细节可参考Brendan对perf的介绍
国外有个妹子对命令做了个小抄: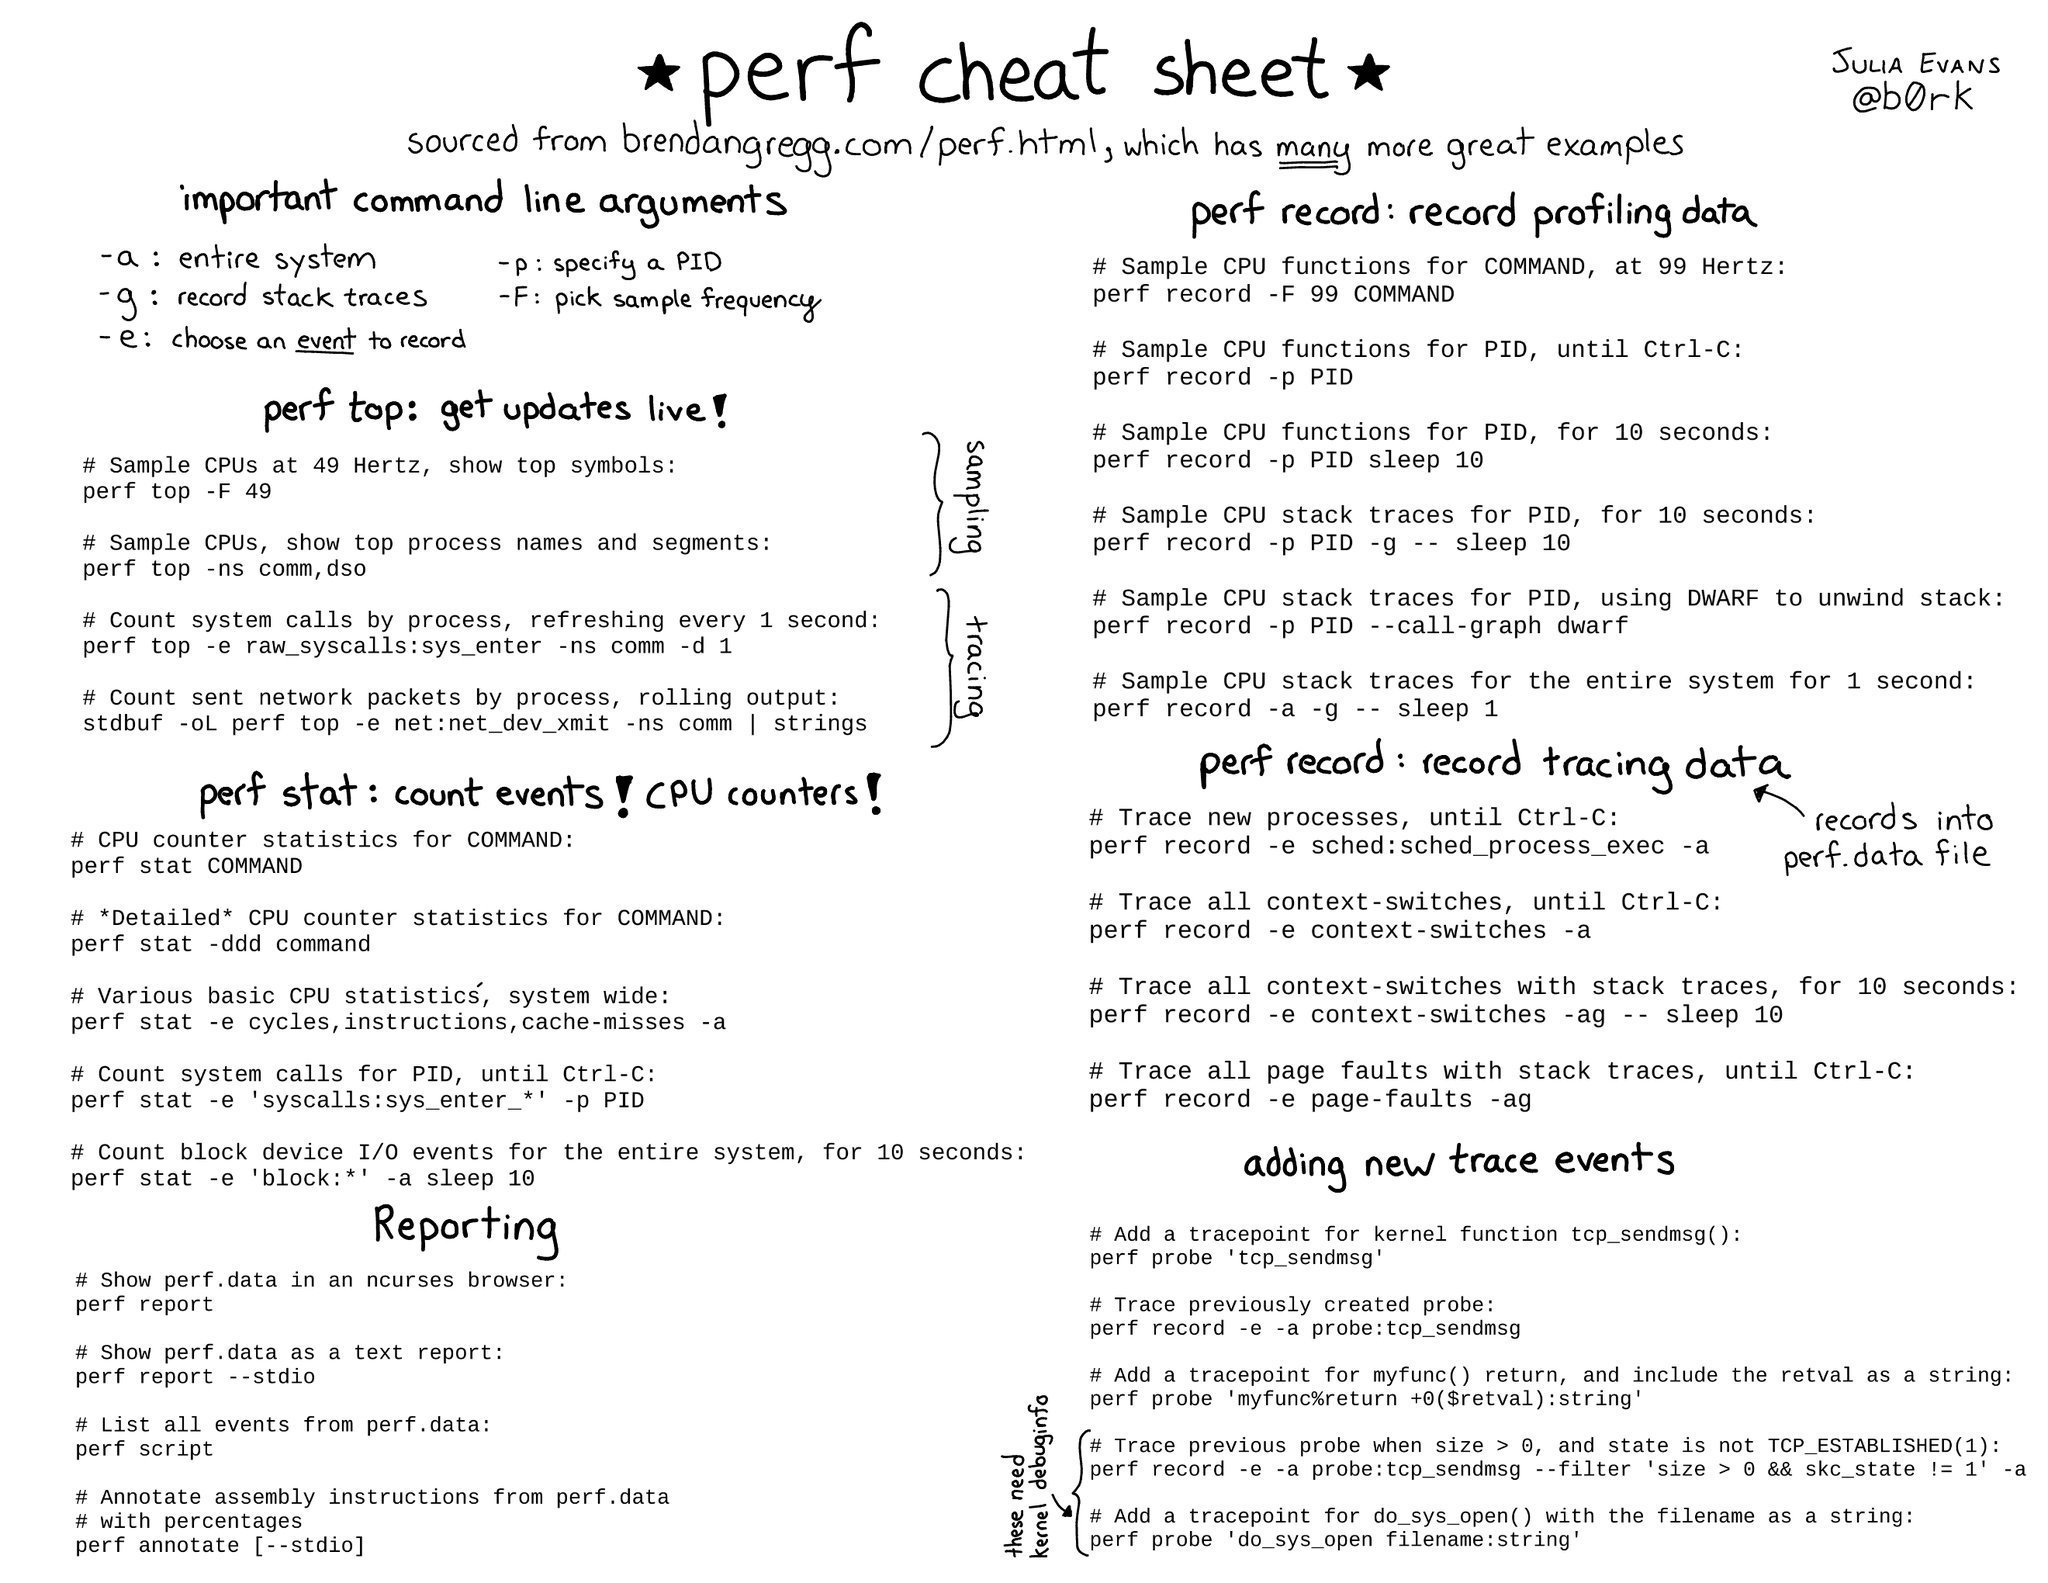
关于栈桢
- 编译要支持frame pointer,-fno-omit-frame-pointer,否则从perf看到的栈是不完整的; 使用-O参数会omit frame pointer
- 一种解决no frame pointer的方法是添加--call-graph dwarf选项,不过需要perf支持
- 如果处理器支持LBR(last branch record),可以采用它来获取有限层的栈桢
- 或者重新编译perf来支持frame pointer
关于事件
引用来自Brendan的图片:
Hardware Events: CPU performance monitoring counters.
Software Events: These are low level events based on kernel counters. For example, CPU migrations, minor faults, major faults, etc.
Kernel Tracepoint Events: This are static kernel-level instrumentation points that are hardcoded in interesting and logical places in the kernel.
User Statically-Defined Tracing (USDT): These are static tracepoints for user-level programs and applications.
Dynamic Tracing: Software can be dynamically instrumented, creating events in any location. For kernel software, this uses the kprobes framework. For user-level software, uprobes.
Timed Profiling: Snapshots can be collected at an arbitrary frequency, using perf record -FHz. This is commonly used for CPU usage profiling, and works by creating custom timed interrupt events.
火焰图学习
Brendan在ACM Queue上文章
对mysql火焰图的一种案例分析: https://queue.acm.org/downloads/2016/Gregg4.svg
尽管perf或者dtrace能够产生栈桢信息用于调优,但有时文字太多仍不直观,无法方便学习和理解
火焰图的特点:
- 鼠标悬浮
- 可点击方块进行缩放
- ctrl+f查找函数名,并summing percentages
使用为三个步骤:
- 使用profiler如perf,dtrace产生profiling data
- 使用火焰图stackcollapse工具对上一步的output转换成folded 中间格式数据。目前此工具支持以下profiler: DTrace, Linux perf_events, FreeBSD pmcstat, Xperf, SystemTap, Xcode Instruments, Intel VTune, Lightweight Java Profiler, Java jstack, and gdb
- 执行flamegraph.pl perl脚本转换成SVG图片
典型用法是:
# git clone https://github.com/brendangregg/FlameGraph
# cd FlameGraph
# perf record -F 99 -a -g -- sleep 60
# perf script | ./stackcollapse-perf.pl | ./flamegraph.pl > out.svg
flame chart也是一种工具,它的横轴是时间,可以大大降低merging,但不适合多线程profiling
火焰图面临的问题
- 栈桢不完整; 有些profiler会截断栈桢,导致frame merging fail;或者编译时omit frame pointer
- 函数名丢失,JIT代码这种情况比较多
- SVG文件大小太大,浏览器加载慢
Brendan火焰图主页
火焰图分析可以有以下几种:
- CPU
- memory
- off-cpu
- hot/cold
- 差分火焰图
火焰图x轴代表栈信息的population,通常按函数名进行排序,不是时间序;y轴表示栈深度;每一长方形代表一个stack frame,越宽代表出现得越多;顶端表示正在运行的函数,下方是它的祖先;火焰图颜色是随机划分的
差分火焰图(differential flame graph)
Cor-Paul的差分火焰图开源实现:http://corpaul.github.io/flamegraphdiff


 1727
1727


 被折叠的 条评论
为什么被折叠?
被折叠的 条评论
为什么被折叠?
 到【灌水乐园】发言


