


所以问题是你要线性(手动)缩放你的值。但是在分散调用中,您传递了一个对数缩放类。您可以直接使用它来规范化绘图调用的值,而不仅仅是传递它:import matplotlib.pyplot as plt
import numpy as np
import matplotlib as mpl
#Fake data
a = np.arange(0,10,1)
b = np.arange(10,20,1)
d = [50]*10
# define vmin and vmax
maxval=1000.0
minval=10.0
# build up colormap and normalizer
colormap = plt.get_cmap('Blues')
norm = mpl.colors.LogNorm(vmax=maxval, vmin=minval)
# helper function to plot the line and the scatter data
def plot_my_scatterdata(x, y, d):
if np.any(np.isnan(d)):
color = 'g'
else:
# use the colormap and the normalization instance!
color = colormap(norm(d[0]))
plt.scatter(a, b, c=d, cmap=colormap, norm=norm, zorder=2, s=50)
plt.plot(a,b, '-', color=color, zorder=1, lw=4)
plot_my_scatterdata(a, b, d)
d = [100]*10
b += 1
plot_my_scatterdata(a, b, d)
d = [500]*10
b += 1
plot_my_scatterdata(a, b, d)
d[0] = np.nan
b += 1
plot_my_scatterdata(a, b, d)
plt.colorbar()
plt.show()
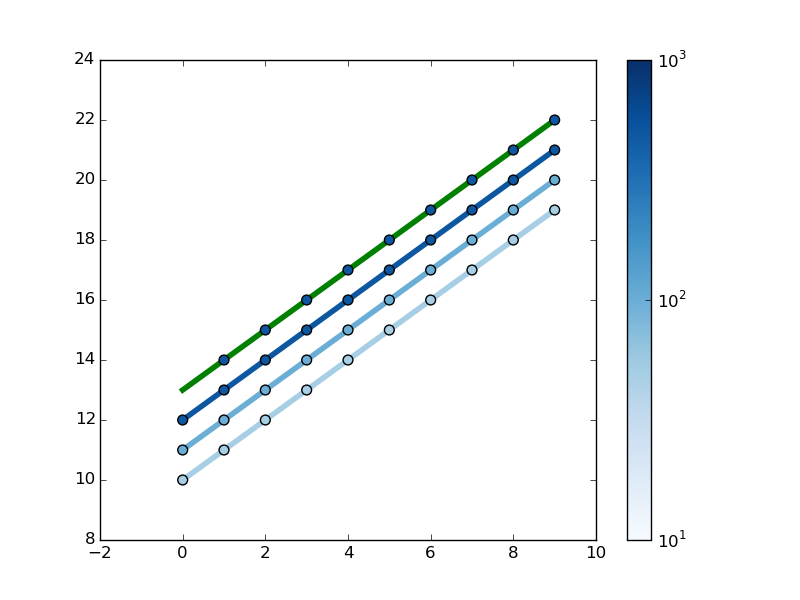
结果:


 485
485


 被折叠的 条评论
为什么被折叠?
被折叠的 条评论
为什么被折叠?
 到【灌水乐园】发言


