


一、基本用法
在LeakDiag中选择aaa.exe
然后选择Windows Heap Allocator来跟踪heap的使用,按start开始,等一会按log,然后再stop
会在c:\leakdiag\Logs下面生成一个log
关键的部分是
<
LEAKS
ver
="1.25.28.2201"
>
< STACK numallocs ="05" size ="048" totalsize ="0240" > <!--内存分配的“总”大小->
< STACKSTATS >
< SIZESTAT size ="048" numallocs ="05" /> <!--内存每次分配的大小和次数-->
< HEAPSTAT handle ="340000" numallocs ="05" />
</ STACKSTATS >
< FRAME num ="0" dll ="aaa.exe" function ="" filename ="" line ="" addr ="0x407a72" offset ="0x00007A72" />
< FRAME num ="1" dll ="aaa.exe" function ="" filename ="" line ="" addr ="0x402ff2" offset ="0x00002FF2" />
< FRAME num ="2" dll ="aaa.exe" function ="" filename ="" line ="" addr ="0x402df9" offset ="0x00002DF9" />
< FRAME num ="3" dll ="aaa.exe" function ="" filename ="" line ="" addr ="0x402dd6" offset ="0x00002DD6" />
< FRAME num ="4" dll ="aaa.exe" function ="" filename ="" line ="" addr ="0x40112f" offset ="0x0000112F" />
< FRAME num ="5" dll ="aaa.exe" function ="" filename ="" line ="" addr ="0x401038" offset ="0x00001038" />
< FRAME num ="6" dll ="aaa.exe" function ="" filename ="" line ="" addr ="0x401269" offset ="0x00001269" />
< FRAME num ="7" dll ="KERNEL32.dll" function ="GetSortTablesFileInfo" offset ="0xC" filename ="" line ="" addr ="0x7C5989D5" />
< STACKID >00524008 </ STACKID >
</ STACK >
</ LEAKS >
其中numallocs是分配的次数,size是每次分配的大小,frame则是leak的时候的call stack
这里的stack只显示了binary,是因为symbol没有配好
把对应的pdb文件路径加到[Tools]-[Option]-Symbol search path,就能得到
<
LEAKS
ver
="1.25.28.2201"
>
< STACK numallocs ="06" size ="048" totalsize ="0288" >
< STACKSTATS >
< SIZESTAT size ="048" numallocs ="06" />
< HEAPSTAT handle ="340000" numallocs ="06" />
</ STACKSTATS >
< FRAME num ="0" dll ="aaa.exe" function ="_heap_alloc_base" offset ="0xC2" filename ="malloc.c" line ="200" addr ="0x407A72" />
< FRAME num ="1" dll ="aaa.exe" function ="_heap_alloc_dbg" offset ="0x1A2" filename ="dbgheap.c" line ="378" addr ="0x402FF2" />
< FRAME num ="2" dll ="aaa.exe" function ="_nh_malloc_dbg" offset ="0x19" filename ="dbgheap.c" line ="248" addr ="0x402DF9" />
< FRAME num ="3" dll ="aaa.exe" function ="_nh_malloc" offset ="0x16" filename ="dbgheap.c" line ="197" addr ="0x402DD6" />
< FRAME num ="4" dll ="aaa.exe" function ="operator new" offset ="0xF" filename ="new.cpp" line ="24" addr ="0x40112F" />
< FRAME num ="5" dll ="aaa.exe" function ="main" offset ="0x28" filename ="D:\Test\aaa\test.cpp" line ="8" addr ="0x401038" />
< FRAME num ="6" dll ="aaa.exe" function ="mainCRTStartup" offset ="0xE9" filename ="crt0.c" line ="206" addr ="0x401269" />
< STACKID >00524008 </ STACKID >
</ STACK >
</ LEAKS >
由test.cpp line 8引起的memory leak.
二、自动检测内存泄露配置
打开leakdiag的安装目录,找到autodiag.ini 把原来的东西删掉,改为下面内容。
[DLPlayer.exe]
;AutoStart entriesEnableAutoStart=1
AutoStartDelay=0
AutoStartAllocator=2
;AutoDump entries
EnableAutoDump=1
AutoDumpInterval=1
AutoDumpOnShutdown=1
;AutoDetect entires
;EnableAutoDetect=0
;HowMuchIsALeak=0
;OverHowMuchTime=0
;HowLongToWaitBeforeLogging=0
几个重要参数的含义
DLPlayer.exe :表示你要检测的应用的名字
AutoStartDelay=0 表示程序运行0分钟后开始记录日志
AutoStartAllocator=2 表示Menory allocator 为windows Heap Allocator
AutoDumpInterval=1 表示每隔1分钟记录一次日志
(注 “ ; ”符号的含义是注释,相当于C语言里的“ // ”)
设置好了后,先启动要检测的程序,再启动leakdiag,点击start, 这样就不需要手动点击log了,系统会自动帮你记录。
三、 内存增长查看【可视化】
1. 下载LDGraher ,点击file-> openfiles 选中要打开的log文件, log文件的目录可以在leakdiag的配置中查看
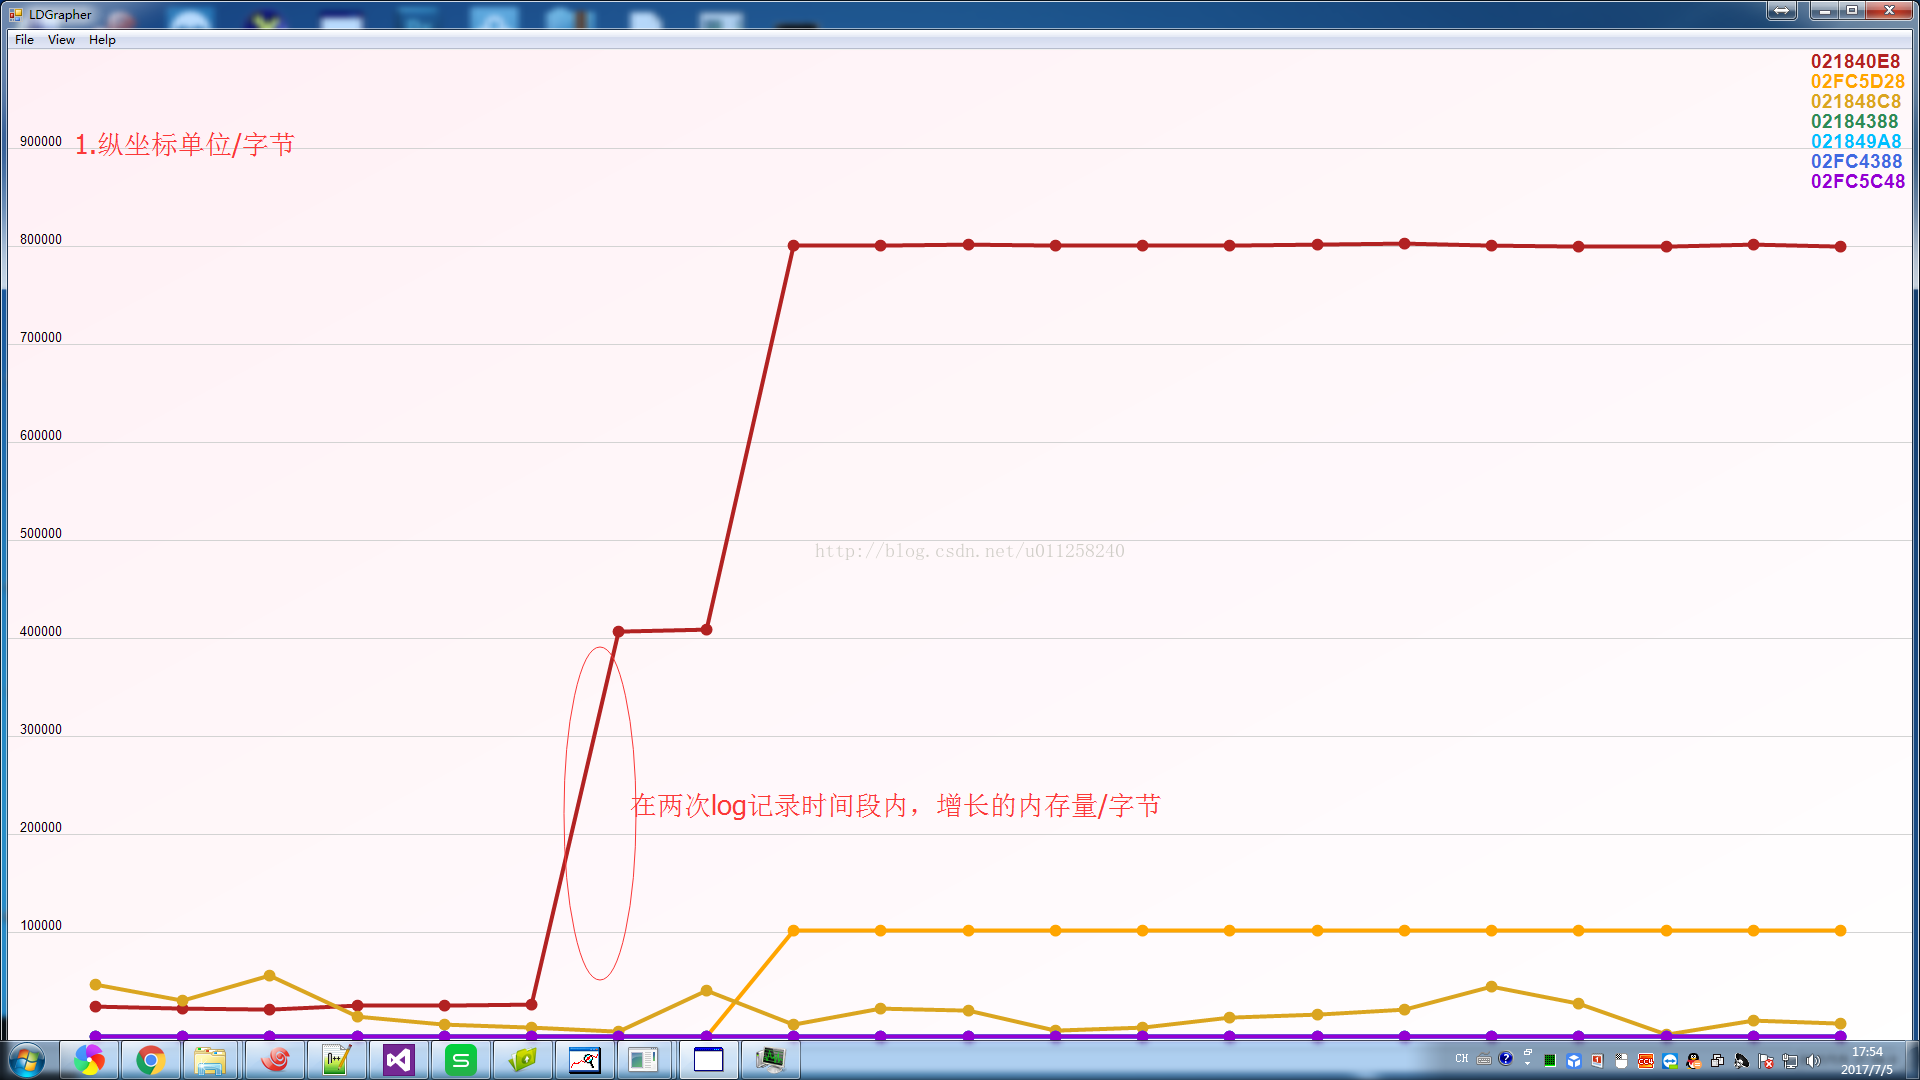
2. 双击图中的红线,可以查看具体发生泄露的函数。


 4581
4581

 被折叠的 条评论
为什么被折叠?
被折叠的 条评论
为什么被折叠?
 到【灌水乐园】发言


