


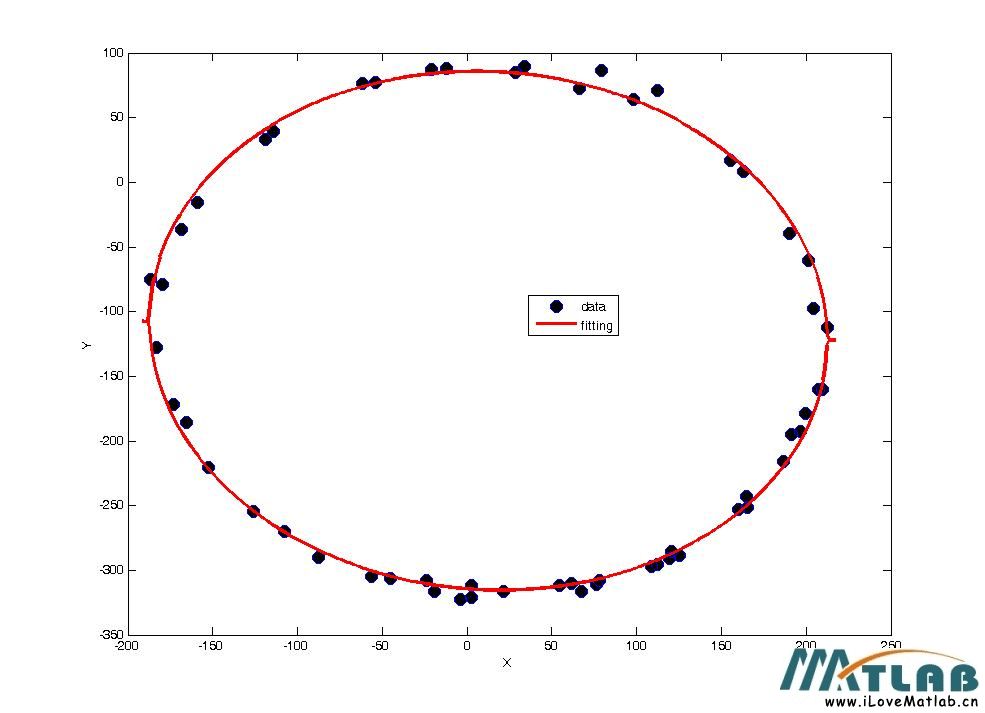
这样的数据只能对1~2维拟合成椭圆,而不能拟合成椭球。
clear,clc
x=[119.6 108.6 78.2 54.3 21.2 -19.3 -56.1 -87.4 -126 -152.7 -173 -183.1 -179.4 -168.4 -159.2 -114.1 -61.6 -12 34 79.1 98.4 155.5 190.4 201.5 212.5 209.8 199.6 164.7 120.5 67.2 -3.7 2.8 76.4 125.1 160.1 191.4 204.2 162.8 112.2 66.2 28.5 -21.2 -54.3 -118.7 -186.8 -165.6 -107.6 -45.1 -23.9 2.8 61.6 112.2 165.6 186.8 196.9 207]';
y=[-290.7 -297.2 -308.2 -311.9 -316.5 -316.5 -304.5 -289.8 -254.8 -220.8 -172 -127.9 -79.1 -36.8 -15.6 39.6 76.4 88.3 89.2 86.5 64.4 16.6 -39.6 -60.7 -112.2 -160.1 -178.5 -242.9 -285.2 -316.5 -322.9 -321.1 -311 -288.9 -253 -195 -97.5 8.3 70.8 72.7 84.6 87.4 77.3 33.1 -75.4 -185.8 -269.6 -306.4 -308.2 -311.9 -310 -295.3 -251.2 -216.2 -192.3 -160.1]';
fx1=@(b,x)b(1)+b(2)*x+sqrt(b(3)+b(4)*x+b(5)*x.^2);
fx2=@(b,x)b(1)+b(2)*x-sqrt(b(3)+b(4)*x+b(5)*x.^2);
b=[-114.412523 -0.03570523351 40023.88755 25.44920693 -1.005630585];
figure(1),clf
plot(x,y,'o','markersize',10,'markerfacecolor','k')
rx=range(x);
x1=linspace(min(x)-rx/85,max(x)+rx/85,350);
y1=fx1(b,x1);
y2=fx2(b,x1);
hold on
plot(x1,y1,'r-','linewidth',2.5)
plot(x1,y2,'r-','linewidth',2.5)
xlabel('X'),ylabel('Y')
legend('data','fitting','location','best')
nh281.jpg
(49.22 KB, 下载次数: 25)
2012-5-25 15:31 上传


 被折叠的 条评论
为什么被折叠?
被折叠的 条评论
为什么被折叠?
 到【灌水乐园】发言


