


概述:
前面的文章中,提到了Arcgis中实现wkt转换为geometry,但是这种转换仅实现了简单的点(point)、线(polyline)和面(polygon)的转换,对于复杂点或者复杂多边形没有涉及,在本文讲述通过terraformers加载展示wkt。
terraformers简介:
terraformers是Esri的一个开源项目,主要功能如下:
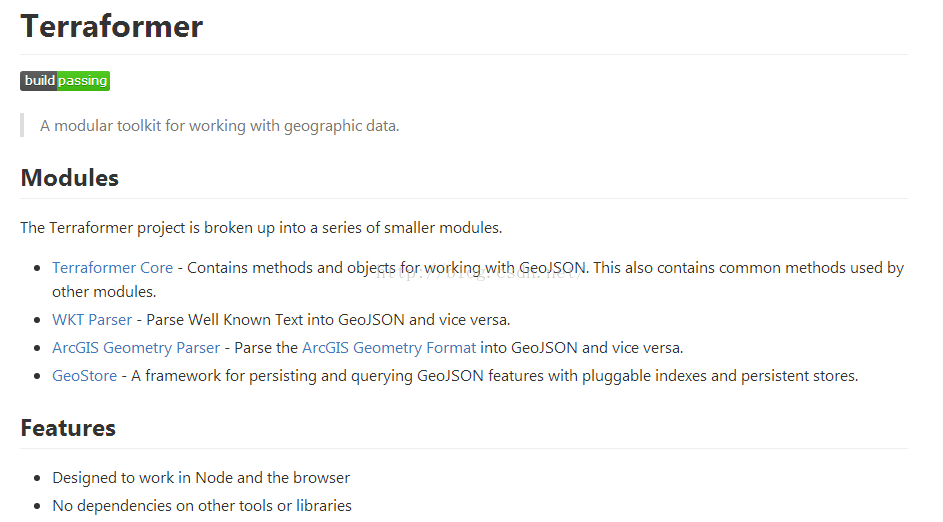
大家可通过http://download.csdn.net/detail/gisshixisheng/9681608下载相关的js文件,也可直接在github上下载,github上的地址为https://github.com/Esri/Terraformer。
实现代码:
1、Arcgis加载WKT
<!DOCTYPE html>
<html>
<head>
    <meta http-equiv="Content-Type" content="text/html; charset=utf-8">
    <meta name="viewport" content="initial-scale=1, maximum-scale=1, user-scalable=no">
    <title>Hello Map</title>
    <link rel="stylesheet" href="http://localhost/arcgis_js_311/api/arcgis_js_api/library/3.11/3.11/dijit/themes/tundra/tundra.css">
    <link rel="stylesheet" href="http://localhost/arcgis_js_311/api/arcgis_js_api/library/3.11/3.11/esri/css/esri.css"><style>
        html, body, #map {
            height: 100%;
            width: 100%;
            margin: 0;
            padding: 0;
        }
    </style>
    <script src="../../plugin/terraformer/terraformer.js"></script>
    <script src="../../plugin/terraformer/terraformer-wkt-parser.js"></script>
    <script src="../../plugin/terraformer/terraformer-arcgis-parser.js"></script>
    <script src="http://localhost/arcgis_js_311/api/arcgis_js_api/library/3.11/3.11/init.js"></script>
    <script src="../../plugin/jquery/jquery-1.8.3.js"></script>
    <script>
        var map;
        require([ "esri/map",
            "esri/layers/ArcGISTiledMapServiceLayer",
            "esri/layers/GraphicsLayer",
            "esri/graphic",
            "esri/geometry/Point",
            "esri/geometry/jsonUtils",
            "esri/symbols/SimpleMarkerSymbol",
            "esri/symbols/SimpleLineSymbol",
            "esri/symbols/SimpleFillSymbol",
            "esri/Color",
            "dojo/domReady!"
        ],
        function(Map,
            Tiled,
            GraphicsLayer,
            Graphic,
        	Point,
        	geometryJsonUtils,
        	SimpleMarkerSymbol,
            SimpleLineSymbol,
            SimpleFillSymbol,
            Color){
            map = new Map("map");
            var tiled = new Tiled("http://localhost:6080/arcgis/rest/services/lzugis/base_china/MapServer");
            map.addLayer(tiled);
            var mapCenter = new Point(103.847, 36.0473, {"wkid":4326});
            map.centerAndZoom(mapCenter,1);
            var gLayer = new GraphicsLayer();
            map.addLayer(gLayer);
            gLayer.on("click",function(feature){
                console.log(feature);
            });
            var wkts = [
                "POINT(107.5758285931443 29.7822116459692)",
                "LINESTRING(120.18304604073 30.3305841465568,108.805692477062 32.0850224203499)",
                "POLYGON((102.797302689433 36.5936423859273,105.519115206186 29.4789248520356,100.346180647351 19.9699202912212))"
            ];
            map.on("load",function(){
            	for(var i=0,len = wkts.length;i<len;i++){
            		var primitive = Terraformer.WKT.parse(wkts[i]);
				    var arcgis = Terraformer.ArcGIS.convert(primitive);
				    var geometry = geometryJsonUtils.fromJson(arcgis);
				    var symbol = getSymbol(geometry.type);
				    var gfx = new Graphic(geometry,symbol);
				    gLayer.add(gfx);
            	}
            });

            function getSymbol(geotype){
            	var symbol = null;
            	if(geotype==="point"){
            		symbol = new SimpleMarkerSymbol(SimpleMarkerSymbol.STYLE_CIRCLE, 12,
                        new SimpleLineSymbol(SimpleLineSymbol.STYLE_SOLID,
                                new Color([255,0,0]), 1),
                        new Color([0,0,255,255]));
            	}
            	else if(geotype==="polyline"){
            		symbol = new SimpleLineSymbol(SimpleLineSymbol.STYLE_SOLID,
                                new Color([255,0,0]), 2);
            	}
            	else{
            		symbol = new SimpleFillSymbol(SimpleFillSymbol.STYLE_SOLID,
					    new SimpleLineSymbol(SimpleLineSymbol.STYLE_DASHDOT,
					    new Color([255,0,0]), 2),new Color([255,255,0,0.25])
					  );
            	}
            	return symbol;
            }
        });
    </script>
</head>
<body>
<div id="map"></div>
</body>
</html>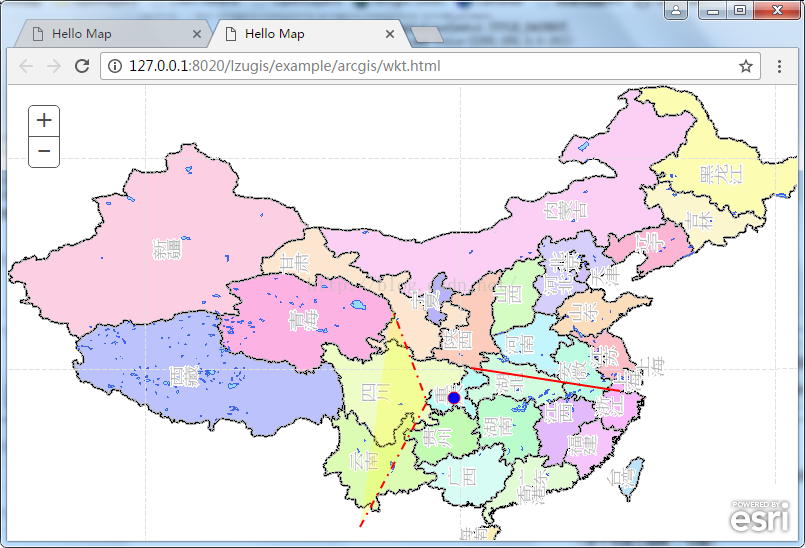
2、leaflet加载WKT
<!DOCTYPE html>
<html>
<head lang="en">
    <meta charset="UTF-8">
    <meta name="viewport" content="width=device-width, initial-scale=1.0, maximum-scale=1.0, user-scalable=no" />
    <title>leaflet</title>
    <link rel="stylesheet" href="../../plugin/leaflet/leaflet.css" type="text/css">
    <style>
        body {
            padding: 0;
            margin: 0;
        }
        html, body, #map {
            height: 100%;
        }
        .leaflet-control-attribution{
            display: none;
        }
    </style>
    <script src="../../plugin/jquery/jquery-1.8.3.js"></script>
    <script src="../../plugin/terraformer/terraformer.js"></script>
    <script src="../../plugin/terraformer/terraformer-wkt-parser.js"></script>
    <script src="../../plugin/leaflet/leaflet.js"></script>
    <script>
        var map;
        $(window).load(function() {
            map = L.map('map').setView([35.851354460363,104.21390114103], 4);//35.851354460363,104.21390114103
            var wms = L.tileLayer.wms("http://localhost:8088/geoserver/lzugis/wms", {
                layers: 'province',
                format: 'image/png',
                transparent: true,
                version:'1.1.1'
            });
            map.addLayer(wms);
            function onEachFeature(feature, layer) {
				var popupContent = "<p>I started out as a WKT " +
						feature.type + ", but now I'm a Leaflet vector!</p>";
				if (feature.properties && feature.properties.popupContent) {
					popupContent += feature.properties.popupContent;
				}
				layer.bindPopup(popupContent);
			}
            var wkts = [
                "POINT(107.5758285931443 29.7822116459692)",
                "LINESTRING(120.18304604073 30.3305841465568,108.805692477062 32.0850224203499)",
                "POLYGON((102.797302689433 36.5936423859273,105.519115206186 29.4789248520356,100.346180647351 19.9699202912212))"
            ];
            var geojsons = [];
            for(var i=0,len = wkts.length;i<len;i++){
            	var geojson = Terraformer.WKT.parse(wkts[i]);
            	geojsons.push(geojson);
            }
            var layer = L.geoJson(geojsons, {onEachFeature: onEachFeature}).addTo(map);
        });
    </script>
</head>
<body>
<div id="map"></div>
</body>
</html>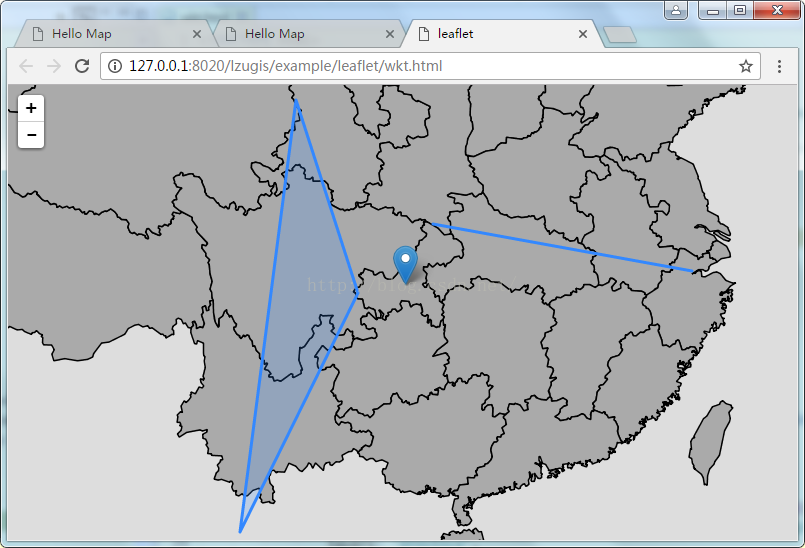
---------------------------------------------------------------------------------------------------------------
技术博客
http://blog.csdn.NET/gisshixisheng
在线教程
http://edu.csdn.Net/course/detail/799
Github
https://github.com/lzugis/
联系方式
q q:1004740957
e-mail:niujp08@qq.com
公众号:lzugis15
Q Q 群:452117357(webgis)
337469080(Android)


 1764
1764


 被折叠的 条评论
为什么被折叠?
被折叠的 条评论
为什么被折叠?
 到【灌水乐园】发言


