


将数据作为一系列以逗号分隔的值(CVS)写入文件,这些文件被称为CVS文件
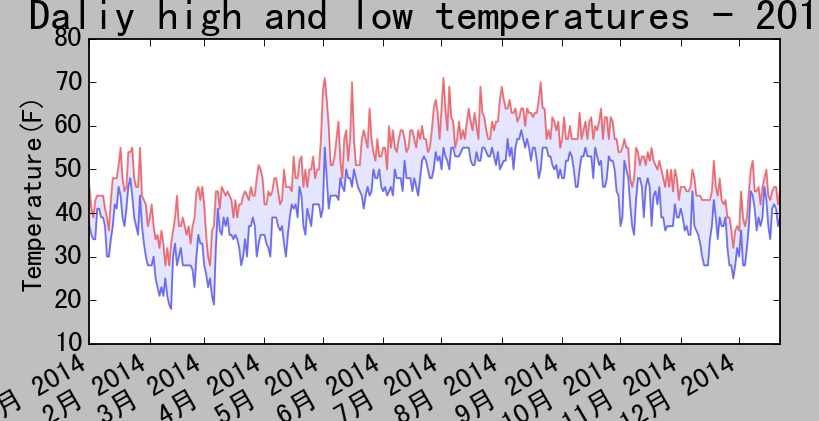
绘制气温图表
 1 import csv
 2 import matplotlib.pyplot as plt
 3 from datetime import datetime
 4
 5
 6 filename = 'sitka_weather_2014.csv'
 7 with open(filename) as f:
 8     """调用方法csv.reader()创建一个阅读器对象,并存储在reader中"""
 9     reader = csv.reader(f)
10     header_row = next(reader)
11     #print(header_row)
12     # for index, colum_header in enumerate(header_row):
13     #     print(index, colum_header)
14
15     dates, highs, lows = [], [], []
16     for row in reader:
17         #将字符串转化为日期对象
18         current_date = datetime.strptime(row[0], "%Y-%m-%d")
19         dates.append(current_date)
20         high = int(row[1])
21         highs.append(high)
22         low = int(row[3])
23         lows.append(low)
24     #print(highs)
25         #print(dates)
26
27     #根据数据绘制图形,alpha为透明度设置
28     fig = plt.figure(dpi=128, figsize=(10, 6))
29     plt.plot(dates, highs, c='red', alpha=0.5)
30     plt.plot(dates, lows, c='blue', alpha=0.5)
31     plt.fill_between(dates, highs, lows, alpha=0.1)#给图表区域着色
32     #设置图形格式
33     plt.title("Daliy high and low temperatures - 2014", fontsize=24)
34     plt.xlabel('', fontsize=16)
35     #绘制倾斜的日期标签
36     fig.autofmt_xdate()
37     plt.ylabel("Temperature(F)", fontsize=16)
38     plt.tick_params(axis='both', which='major', labelsize=16)
39
40     plt.show()
Figure:
错误检查:
 1 import csv
 2 import matplotlib.pyplot as plt
 3 from datetime import datetime
 4
 5
 6 filename = 'death_valley_2014.csv'
 7 with open(filename) as f:
 8     """调用方法csv.reader()创建一个阅读器对象,并存储在reader中"""
 9     reader = csv.reader(f)
10     header_row = next(reader)
11     #print(header_row)
12     # for index, colum_header in enumerate(header_row):
13     #     print(index, colum_header)
14
15     dates, highs, lows = [], [], []
16     for row in reader:
17         try:
18         #将字符串转化为日期对象
19             current_date = datetime.strptime(row[0], "%Y-%m-%d")
20             high = int(row[1])
21             low = int(row[3])
22         except ValueError:
23             print(current_date, "missing data")
24         else:
25             dates.append(current_date)
26             highs.append(high)
27             lows.append(low)
28     #print(highs)
29         #print(dates)
30
31     #根据数据绘制图形,alpha为透明度设置
32     fig = plt.figure(dpi=128, figsize=(10, 6))
33     plt.plot(dates, highs, c='red', alpha=0.5)
34     plt.plot(dates, lows, c='blue', alpha=0.5)
35     plt.fill_between(dates, highs, lows, alpha=0.1)#给图表区域着色
36     #设置图形格式
37     plt.title("Daliy high and low temperatures - 2014", fontsize=24)
38     plt.xlabel('', fontsize=16)
39     #绘制倾斜的日期标签
40     fig.autofmt_xdate()
41     plt.ylabel("Temperature(F)", fontsize=16)
42     plt.tick_params(axis='both', which='major', labelsize=16)
43
44     plt.show()
Figure:

用try-except-else 来处理数据缺失的问题。
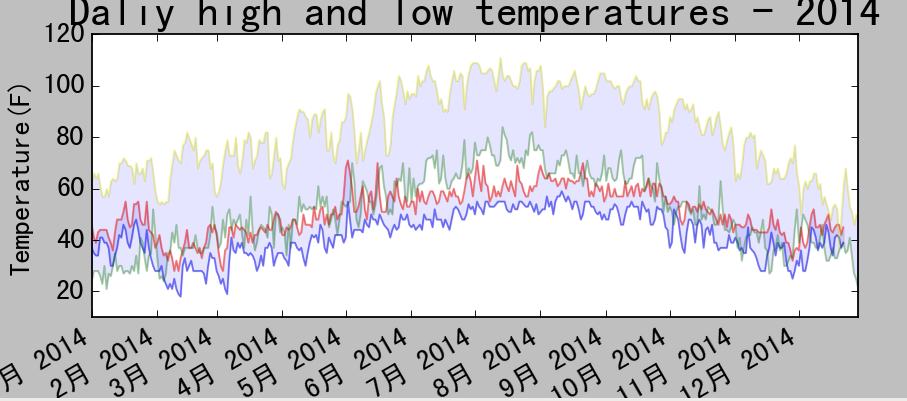
将2个数据集画在同一个图表上:
 1 import csv
 2 import matplotlib.pyplot as plt
 3 from datetime import datetime
 4
 5
 6 filename_1 = 'sitka_weather_2014.csv'
 7 filename_2 = 'death_valley_2014.csv'
 8 with open(filename_1) as f1, open(filename_2) as f2:
 9     """调用方法csv.reader()创建一个阅读器对象,并存储在reader中"""
10     reader_1 = csv.reader(f1)
11     header_row_1 = next(reader_1)
12     reader_2 = csv.reader(f2)
13     header_row_2 = next(reader_2)
14     #print(header_row)
15     # for index, colum_header in enumerate(header_row):
16     #     print(index, colum_header)
17
18     dates_1, dates_2, highs_1, lows_1, highs_2, lows_2 = [], [], [], [], [], []
19     for row in reader_1:
20         try:
21         #将字符串转化为日期对象
22             current_date_1 = datetime.strptime(row[0], "%Y-%m-%d")
23             high_1 = int(row[1])
24             low_1 = int(row[3])
25         except ValueError:
26             print(current_date_1, "missing data")
27         else:
28             dates_1.append(current_date_1)
29             highs_1.append(high_1)
30             lows_1.append(low_1)
31
32     for row in reader_2:
33         try:
34         #将字符串转化为日期对象
35             current_date_2 = datetime.strptime(row[0], "%Y-%m-%d")
36             high_2 = int(row[1])
37             low_2 = int(row[3])
38         except ValueError:
39             print("missing data")
40             # high_2 = highs_2[-1]
41             # low_2 = lows_2[-1]
42         else:
43             dates_2.append(current_date_2)
44             highs_2.append(high_2)
45             lows_2.append(low_2)
46     #print(highs)
47         #print(dates)
48
49     #根据数据绘制图形,alpha为透明度设置
50     fig = plt.figure(dpi=128, figsize=(10, 6))
51     plt.plot(dates_1, highs_1, c='red', alpha=0.5)
52     plt.plot(dates_1, lows_1, c='blue', alpha=0.5)
53     plt.fill_between(dates_1, highs_1, lows_1, alpha=0.1)#给图表区域着色
54     plt.plot(dates_2, highs_2, c='yellow', alpha=0.5)
55     plt.plot(dates_2, lows_2, c='green', alpha=0.5)
56     plt.fill_between(dates_2, highs_2, lows_2, alpha=0.1)  # 给图表区域着色
57     #设置图形格式
58     plt.title("The contrast of two places'temperatures-2014", fontsize=24)
59     plt.xlabel('', fontsize=16)
60     #绘制倾斜的日期标签
61     fig.autofmt_xdate()
62     plt.ylabel("Temperature(F)", fontsize=16)
63     plt.tick_params(axis='both', which='major', labelsize=16)
64
65     plt.ylim([10, 120])#给y轴设置上下限
66     plt.show()
这样代码过于重复,我们可以创建一个提取天气信息的函数
 1 import csv
 2 import matplotlib.pyplot as plt
 3 from datetime import datetime
 4
 5
 6 def get_weather_data(filename, dates, highs, lows):
 7     with open(filename) as f:
 8         """调用方法csv.reader()创建一个阅读器对象,并存储在reader中"""
 9         reader = csv.reader(f)
10         header_row = next(reader)
11         #print(header_row)
12         # for index, colum_header in enumerate(header_row):
13         #     print(index, colum_header)
14
15         #dates, highs, lows = [], [], []
16         for row in reader:
17             try:
18             #将字符串转化为日期对象
19                 current_date = datetime.strptime(row[0], "%Y-%m-%d")
20                 high = int(row[1])
21                 low = int(row[3])
22             except ValueError:
23                 print(current_date, "missing data")
24             else:
25                 dates.append(current_date)
26                 highs.append(high)
27                 lows.append(low)
28
29
30 filename_1 = 'sitka_weather_2014.csv'
31 dates, highs, lows = [], [], []
32 get_weather_data(filename_1, dates, highs, lows)
33 #根据数据绘制图形,alpha为透明度设置
34 fig = plt.figure(dpi=128, figsize=(10, 6))#创建一个窗口
35 plt.plot(dates, highs, c='red', alpha=0.5)
36 plt.plot(dates, lows, c='blue', alpha=0.5)
37 plt.fill_between(dates, highs, lows, alpha=0.1)#给图表区域着色
38
39 filename_2 = 'death_valley_2014.csv'
40 dates, highs, lows = [], [], []
41 get_weather_data(filename_2, dates, highs, lows)
42 #根据数据绘制图形,alpha为透明度设置
43 #fig = plt.figure(dpi=128, figsize=(10, 6)),不要再次创建一个新窗口
44 plt.plot(dates, highs, c='yellow', alpha=0.3)
45 plt.plot(dates, lows, c='green', alpha=0.3)
46 plt.fill_between(dates, highs, lows, alpha=0.1)#给图表区域着色
47
48
49 #设置图形格式
50 plt.title("Daliy high and low temperatures - 2014", fontsize=24)
51 plt.xlabel('', fontsize=16)
52 #绘制倾斜的日期标签
53 fig.autofmt_xdate()
54 plt.ylabel("Temperature(F)", fontsize=16)
55 plt.tick_params(axis='both', which='major', labelsize=16)
56
57 plt.ylim([10, 120])
58 plt.show()
Figure:


 2032
2032


 被折叠的 条评论
为什么被折叠?
被折叠的 条评论
为什么被折叠?
 到【灌水乐园】发言


