| huwlnew | 2010-05-06 13:24 | 基本的数据绑定
一.数据源
说到绘制图表,可能很多人的第一反应除了是图表呈现的方式外,更关心的便是数据如何添加,记得在很多年前,哪时要绘制一个数据曲线图,一直找不到好的呈现方式,后来使用了SVG的绘图模式,不过在添加数据的时候可谓吃尽了苦头,毕竟,SVG只是一种描述语言,要动态的实现一个图表的绘制,是非常困难的.对于微软的图表控件,数据添加是一件很简单的方式,它支持多种数据添加方式,如:
- 可以在图表的设计界面,在属性设置窗口中的Series属性下的Points中添加需要的数据.
- 可以在图表的设计界面中,在属性中绑定一个数据源.
- 可以在后台代码中,动态添加数据.
- 可以在后台代码中设置一个或多个数据源,直接绑定到图表中.
在此处,我只着重讲解一下第3,4两点.对于第3点,相对来说比较简单,在后台代码中,找到要添加代码的Series,通过它下面Points的Add、AddXY、AddY等方法,即可以实现数据的添加.例如:
[pre]  Code Code
Code highlighting produced by Actipro CodeHighlighter (freeware)
http://www.CodeHighlighter.com/
-->double t;
for(t = 0; t <= (2.5 * Math.PI); t += Math.PI/6)
{
double ch1 = Math.Sin(t);
double ch2 = Math.Sin(t-Math.PI/2);
Chart1.Series["Channel 1"].Points.AddXY(t, ch1);
Chart1.Series["Channel 2"].Points.AddXY(t, ch2);
}[/pre]
(注:代码摘自微软的例子,上例中,Chart1为图表的名字,Channel 1、Channel 2分别表示两个Series数据序列)
二.绑定数据
先来看看图表控件都支持什么类型的数据绑定,根据官方文档的说法,只要是实现了IEnumerable接口的数据类型,都可以绑定到图表控件中,例如:DataView, DataReader, DataSet, DataRow, DataColumn, Array, List, SqlCommand, OleDbCommand, SqlDataAdapter, 及OleDbDataAdapter对象。
对于开发来说,最常用的还是DataView、DataReader、DataSet、DataRow、Array、List这几种类型了,有几点需要注意一下:
- 图表控件支持多数据源的绑定,例如:X轴绑定一个数据集ds1,Y轴可以绑定另一个数据集ds2,当然也可以是X轴绑定到一个List数据对象,Y轴绑定到一个DataView对象等等。
- 图表控件的绑定方式一般有两种,常规绑定及交差表的绑定。
- 图表控件的Y轴数据,支持一次绑定多个值,以绘制时间、区域、使用量等之类的图形。
绑定数据的流程如下:

大意是,绑定数据里面是否有分组数据需要绑定,如果有,则调用交叉表绑定的方法。否则判断是否时绑定X轴和Y轴(包括标签、超链接、图例文字等自定义属性),如果是,则调用Points.DataBind方法进行绑定操作。再判断是否有不同的X轴或Y轴数据,如果有,则分别调用X,Y轴的绑定方法Points.DataBindX,Points.DataBindY进行数据绑定。最后,再判断是否需要进行多个Y轴值的绑定。
下面分别对几种数据绑定的方法进行一下说明:
1.绑定一张数据表
绑定一张数据表,例如绑定一张普通的数据表,表数据如下:
REPS
绑定方法的代码:
[pre]Code
Code highlighting produced by Actipro CodeHighlighter (freeware)
http://www.CodeHighlighter.com/
-->string mySelectQuery="SELECT Name, Sales FROM REPS;";
OleDbConnection myConnection = new OleDbConnection(myConnectionString);
OleDbCommand myCommand = new OleDbCommand(mySelectQuery, myConnection);
myCommand.Connection.Open();
OleDbDataReader myReader = myCommand.ExecuteReader(CommandBehavior.CloseConnection);
Chart1.DataBindTable(myReader, "Name");
myReader.Close();
myConnection.Close();[/pre]
因为数据源中只有两列Name和Sales,因此在调用Chart1.DataBindTable方法的时候,告诉了图表X轴的名称为Name,因此自动将Sales设置为Y轴的数据了.生成的图形如下:

如果修改一下Sql语句为:SELECT Name,ID,RegionID FROM REPS;其它都不变化,再看看图表是如何处理另外两个字段的,生成的图表如下:

此时,图表自动将ID,RegionID字段当成了Y值,生成了两个Series,因此每个用户都有两个值,生成的图形也有两个柱状图.
上面是一种动态绑定的方式,有人可能会问了,如果我想确定我要绑定的列,比如:X轴绑定某个字段,Y轴绑定某个字段如何操作呢?对于这种绑定,有几种方法可以实现.
第一种:这种方法可能是很常见的,在原来的.NET编程中出现的机率非常之高,方法如下:
[pre]Code
Code highlighting produced by Actipro CodeHighlighter (freeware)
http://www.CodeHighlighter.com/
-->// 设置数据源,myDv是一个取出数据集的DataView
chart1.DataSource = myDv;
// 分别设置图表的X值和Y值
chart1.Series["Series1"].XValueMember = "Name";
chart1.Series["Series1"].YValueMembers = "Sales";
// 绑定设置的数据
chart1.DataBind();
[/pre]
第二种:即直接调用点的绑定方法
[pre]Code
Code highlighting produced by Actipro CodeHighlighter (freeware)
http://www.CodeHighlighter.com/
-->//myReader为取得的DataReader对象
Chart1.Series["Series1"].Points.DataBindXY(myReader, "Name", myReader, "Sales");
[/pre]
第三种:调用DataBind的方法实现
[pre]Code
Code highlighting produced by Actipro CodeHighlighter (freeware)
http://www.CodeHighlighter.com/
-->Chart1.Series["Series1"].Points.DataBind(myReader, "Name", "Sales", "");[/pre]
上面几种方法得到的效果都是一样的.当然了,上面三种方法需要自己建立Series,要显示两个柱状图,像上面的例子中的图形,那么得手动建立两个Series,然后分别进行上面的绑定操作。
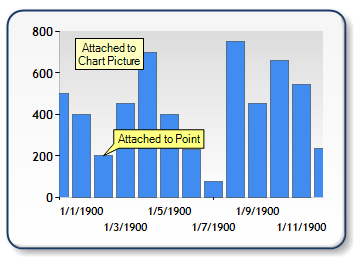
此处说一下Label和Tooltip的绑定方式,要在绑定的图表中显示标签(Label)及提示(Tooltip),可以在绑定的时候,设置绑定的属性.对于上面的第一、二种方法,可以调用如下的方法来设置Label和Tooltip;例如,两个数据序列名称分别为Series1和Series2,设置代码如下:
[pre]Code
Code highlighting produced by Actipro CodeHighlighter (freeware)
http://www.CodeHighlighter.com/
-->Chart1.Series["Series1"].Label = "#VAL";
Chart1.Series["Series1"].Points.DataBind(myDs.Tables[0].DefaultView, "Name", "ID", "");
Chart1.Series["Series2"].Label = "#VAL";
Chart1.Series["Series2"].Points.DataBind(myDs.Tables[0].DefaultView, "Name", "RegionID", "");[/pre]
其中的#VAL是Label和Tooltip的通配符,表示取默认Y轴变量的意思。具体的详细操作可以参考例程:Chart Features/Labels下面的内容。以后有空我也写一篇Label的和其它变量的设置吧。
对于第三种调用的绑定则稍微不同,如下:
[pre]Code
Code highlighting produced by Actipro CodeHighlighter (freeware)
http://www.CodeHighlighter.com/
-->Chart1.Series["Series1"].Points.DataBind(myDs.Tables[0].DefaultView, "Name", "ID","Label=ID,ToolTip=RegionID");
Chart1.Series["Series2"].Points.DataBind(myDs.Tables[0].DefaultView, "Name", "RegionID","Label=RegionID,ToolTip=ID");[/pre]
其实就是利用第三个属性,通过格式化的字符串来设置绑定属性,Label表示标签,ToolTip表示提示信息,Url表示超链接等等。最后生成的图片如下:

2.绑定一个交叉表
微软的图表控件提供了一个交叉表数据的绑定方法DataBindCrossTable,它可以根据数据动态的生成数据序列(Series),借用官方的例子,数据库的表数据如下:

REPSALES
我们先看看DataBindCrossTable的参数,它有两个重载方法,分别是:
public void DataBindCrossTable (
IEnumerable dataSource,
string seriesGroupByField,
string xField,
string yFields,
string otherFields,
PointSortOrder sortingOrder
)
以及
public void DataBindCrossTable (
IEnumerable dataSource,
string seriesGroupByField,
string xField,
string yFields,
string otherFields
)
每个参数的含义如下:
dataSource 要绑定的数据源.
seriesGroupByField 要分组统计的数据字段名称,例如按姓名、日期等.
xField X轴绑定的字段名称.
yFields Y轴绑定的字段名称,如果需要绑定多个字段,则用逗号将字段名分开.
otherFields 其它数据字段属性,就是上面刚讲的,标签、提示、Url等属性.
sortingOrder 设置数据是正确还是逆序排列.
此时要以统计每个用户的年销售曲线,那么分组统计的字段名应该设置为Name,如下:
[pre]Code
Code highlighting produced by Actipro CodeHighlighter (freeware)
http://www.CodeHighlighter.com/
-->Chart1.DataBindCrossTable(
myReader,
"Name",
"Year" ,
"Sales",
"Label=Commissions{C}");[/pre]
用如上的方法绑定,生成的图形如下:
相反,如果要统计用户每年的曲线,则将字段反转一下即可,如下:
[pre]Code
Code highlighting produced by Actipro CodeHighlighter (freeware)
http://www.CodeHighlighter.com/
-->Chart1.DataBindCrossTable(
myReader,
"Year",
"Name",
"Sales",
"Label=Commissions{C}");[/pre]
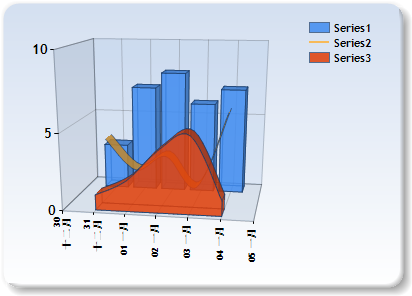
生成的曲线图如下:

这次就先说到这里咯,说几个需要注意的地方:
- 在进行Y轴数据绑定的时候,如果要绑定多个字段,默认情况会出错,那是因为需要设置Y轴的可保存值数量,设置为你需要保存的数量即可,设置的地点在:Series-》YValuesPrePoint,设置为你需要显示的个数即可。
- 在进行DataTable绑定的时候,Label、ToolTip等属性的字段格式化比较困难(otherFields 属性),我试了半天,也就试出了一次只能绑定一个字段,因为是和数据集绑定,如果要在标签上增加文字的话,可以使用:Field{xxxx#xxxx},其中#会替换为相应的文字,例如:Field的值为45,那么最后的呈现的结果就是:xxxx45XXXX.
|
|


 1170
1170


 被折叠的 条评论
为什么被折叠?
被折叠的 条评论
为什么被折叠?
 到【灌水乐园】发言


