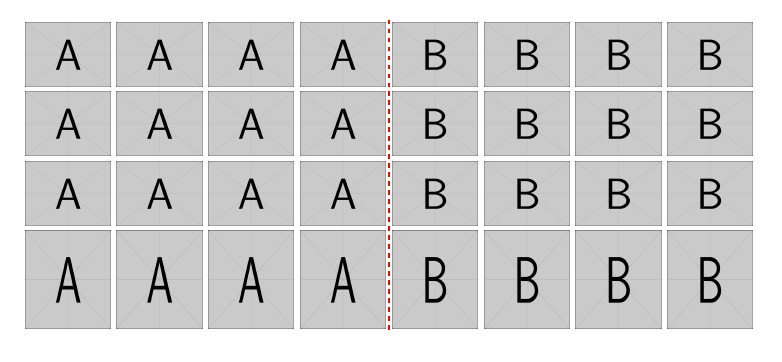
近期论文用到这个效果。 先实现下, 嘿嘿。
\documentclass{article}
\usepackage{tikz,lscape,amsmath}
\usepackage[margin=1cm]{geometry}
\usetikzlibrary{matrix}


\begin{document}

\def\arraystretch{0.5}
\tikzset{
table/.style={
  matrix of nodes,
  row sep=-\pgflinewidth,  % <-- This adjusts the row separation
  column sep=\pgflinewidth,% <-- This adjusts the column separation
  nodes={rectangle,draw=none, text width=2cm, align=center,inner sep=2pt,outer sep=0pt},
%  nodes in empty cells
  }
}
\begin{tikzpicture}

\matrix (mat) [table]
{
\includegraphics[width=2cm]{example-image-A} & \includegraphics[width=2cm]{example-image-A} & \includegraphics[width=2cm]{example-image-A} & \includegraphics[width=2cm]{example-image-A} & \includegraphics[width=2cm]{example-image-B}
& \includegraphics[width=2cm]{example-image-B} &  \includegraphics[width=2cm]{example-image-B} &  \includegraphics[width=2cm]{example-image-B}\\
\includegraphics[width=2cm]{example-image-A} & \includegraphics[width=2cm]{example-image-A}  &\includegraphics[width=2cm]{example-image-A}&\includegraphics[width=2cm]{example-image-A}  &\includegraphics[width=2cm]{example-image-B}  & \includegraphics[width=2cm]{example-image-B} &  \includegraphics[width=2cm]{example-image-B}&  \includegraphics[width=2cm]{example-image-B}\\
\includegraphics[width=2cm]{example-image-A} & \includegraphics[width=2cm]{example-image-A}  &\includegraphics[width=2cm]{example-image-A}&\includegraphics[width=2cm]{example-image-A}  &\includegraphics[width=2cm]{example-image-B}  & \includegraphics[width=2cm]{example-image-B} &  \includegraphics[width=2cm]{example-image-B}&  \includegraphics[width=2cm]{example-image-B}\\
\includegraphics[width=2cm,height=2.3cm]{example-image-A} & \includegraphics[width=2cm,height=2.3cm]{example-image-A}  &\includegraphics[width=2cm,height=2.3cm]{example-image-A}&\includegraphics[width=2cm,height=2.3cm]{example-image-A}  &\includegraphics[width=2cm,height=2.3cm]{example-image-B}& \includegraphics[width=2cm,height=2.3cm]{example-image-B} &  \includegraphics[width=2cm,height=2.3cm]{example-image-B} &  \includegraphics[width=2cm,height=2.3cm]{example-image-B}\\
};
\draw[red,dashed,very thick](mat-1-4.north east)--(mat-4-4.south east);  %<-- This is for the red line in the middle
\end{tikzpicture}


\end{document}
效果:
大家学习吧。
可是我自己用在论文中有个bug。 大家測试下, 有什么改进的方法哟。 欢迎指出来哟。


 3808
3808


 被折叠的 条评论
为什么被折叠?


