


最近由于项目需要,要做几个统计图. 网上找了找发现了ZedGraph控件和dotnetCHARTIN控件.
ZedGraph: 支持winform和webform。支持可视化设计,并且最主要他是开源的.
dotnetCHARTIN:需要到网上找破解版的 下载地址:http://files.cnblogs.com/xiaogangqq123/dotnetcharting.rar
网上说dotnetCHARTIN这个控件比较耗费性能.并且支持二维和三维.ZedGraph控件开源.扩展性强,但是只支持二维图形.性能较好.
由于项目需要三维的 所以选择了dotnetCHARTIN这个.通过几次反复测试.感觉dotnetCHARTIN性能还行.当然是在理想情况下.
由于网上dotnetCHARTIN资料较少.看了下帮助文档..自己做了个Demo分别对10条线一万条数据和10条10万条数据做了个初步测试.
1万条:生成图片速度大概在2秒到5秒;
10万条:速度估计在5秒-10秒之间 ,
大体是这个样子.贴出代码:
public class Charting
{
#region 共有变量

/// <summary>
/// 图片存放路径
/// </summary>
public string PhaysicalImagePath { get; set; }

/// <summary>
/// 标题
/// </summary>
public string Title { get; set; }

/// <summary>
/// X轴名称
/// </summary>
public string XName { get; set; }

/// <summary>
/// Y轴名称
/// </summary>
public string YName { get; set; }

/// <summary>
/// 图例名称
/// </summary>
public string SeriseName { get; set; }

/// <summary>
/// 宽度
/// </summary>
public int SeriseWidth { get; set; }

/// <summary>
/// 高度
/// </summary>
public int SeriseHeight { get; set; }

/// <summary>
/// 数据源
/// </summary>
public DataTable DataSoure { get; set; }

public bool IsUse3D { get; set; }

public CharType type { get; set; }
#endregion

public Charting() { }

/// <summary>
/// 柱形图
/// </summary>
/// <returns></returns>
public void CreateCombo(dotnetCHARTING.Chart Chart1)
{
Chart1.Title = Title;
Chart1.XAxis.Label.Text = XName;
Chart1.YAxis.Label.Text = this.YName;
Chart1.TempDirectory = this.PhaysicalImagePath;
Chart1.Width = this.SeriseWidth;
Chart1.Height = this.SeriseHeight;
Chart1.Type = ChartType.Combo;

Chart1.Series.Type = SeriesType.Cylinder;
Chart1.Series.Name = this.SeriseName;
Chart1.Series.Data = this.DataSoure;
Chart1.SeriesCollection.Add();
Chart1.DefaultSeries.DefaultElement.ShowValue = true;
Chart1.ShadingEffect = true;
Chart1.Use3D = IsUse3D;
Chart1.Series.DefaultElement.ShowValue = true;
}

/// <summary>
/// 饼图
/// </summary>
/// <returns></returns>
public void CreatePie(dotnetCHARTING.Chart Chart1)
{
Chart1.Title = Title;
Chart1.XAxis.Label.Text = XName;
Chart1.YAxis.Label.Text = this.YName;
Chart1.TempDirectory = this.PhaysicalImagePath;
Chart1.Width = this.SeriseWidth;
Chart1.Height = this.SeriseHeight;
Chart1.Type = ChartType.Pie;
Chart1.Series.Type = SeriesType.Cylinder;
Chart1.Series.Name = this.SeriseName;
Chart1.ShadingEffect = true;
Chart1.Use3D = IsUse3D;
Chart1.DefaultSeries.DefaultElement.Transparency = 20;
Chart1.DefaultSeries.DefaultElement.ShowValue = true;
Chart1.PieLabelMode = PieLabelMode.Outside;
Chart1.SeriesCollection.Add(getArrayData());
Chart1.Series.DefaultElement.ShowValue = true;
}

private SeriesCollection getArrayData()
{
SeriesCollection SC = new SeriesCollection();
DataTable dt = this.DataSoure;
for (int i = 0; i < dt.Rows.Count; i++)
{
Series s = new Series();
s.Name = dt.Rows[i][0].ToString();

Element e = new Element();

// 每元素的名称
e.Name = dt.Rows[i][0].ToString();

// 每元素的大小数值
e.YValue = Convert.ToDouble(dt.Rows[i][1].ToString());

s.Elements.Add(e);
SC.Add(s);
}
return SC;

}

/// <summary>
/// 曲线图
/// </summary>
/// <returns></returns>
public void CreateLine(dotnetCHARTING.Chart Chart1)
{
Chart1.Title = Title;
Chart1.XAxis.Label.Text = XName;
Chart1.YAxis.Label.Text = this.YName;
Chart1.TempDirectory = this.PhaysicalImagePath;
Chart1.Width = this.SeriseWidth;
Chart1.Height = this.SeriseHeight;

Chart1.Type = ChartType.Combo;
//此处一定要用DefaultSeries.Type = SeriesType.Line 否则没效果
Chart1.DefaultSeries.Type = SeriesType.Line;
Chart1.Series.Name = this.SeriseName;
Chart1.Series.Data = this.DataSoure;

Chart1.SeriesCollection.Add();

Chart1.DefaultSeries.DefaultElement.ShowValue = true;
Chart1.ShadingEffect = false;
Chart1.Use3D = IsUse3D;
Chart1.Series.DefaultElement.ShowValue = true;
}
}
前台调用Code:
Charting ch = new Charting();
ch.Title = "统计";
ch.XName = "国家";
ch.YName = "数量(亿)";
ch.SeriseName = "Num";
ch.SeriseHeight = 500;
ch.SeriseWidth = 1240;
ch.PhaysicalImagePath = "temp";
ch.DataSoure = GetData.GetTablePie();
ch.IsUse3D = true;
//创建图形,Chart1页面dotnetChartin的控件ID
ch.CreatePie(Chart1);
如果有多条数据(也就是有多条线),比如柱形图和折线图 可以多次调用CreateLine(),CreateCombo()并制定不用的数据源.和SeriseName
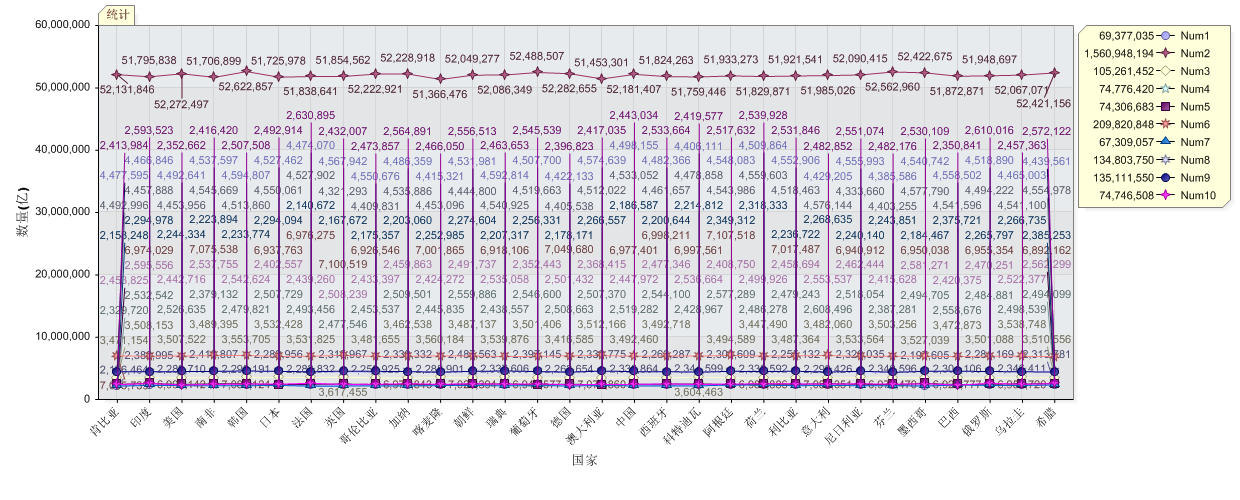
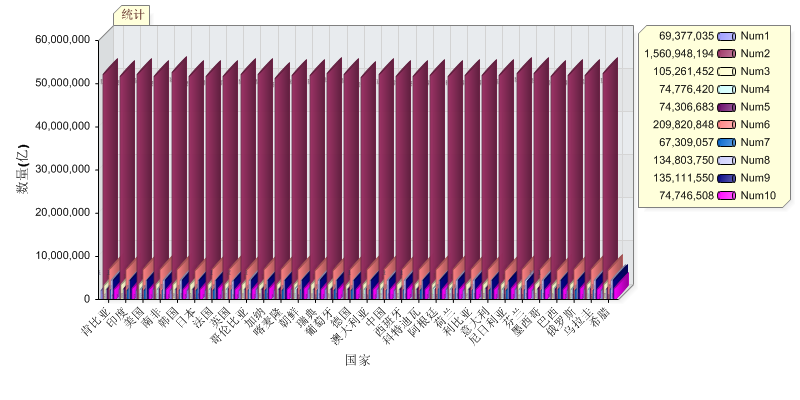
效果图:
折线图:
柱状图:
圆饼图:
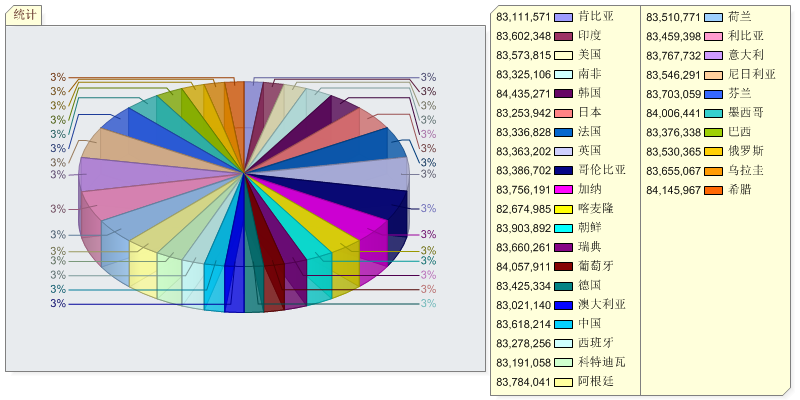
都是一些测试数据..大家看起来图形比较乱.主要我用的数据量很大.这个是10万多条吧..实际上统计用不了这么多.
我也是为了测试下这么数据生成图片的性能如何.
原文地址:http://www.cnblogs.com/xiaogangqq123/archive/2010/06/12/1756845.html


 1359
1359

 被折叠的 条评论
为什么被折叠?
被折叠的 条评论
为什么被折叠?
 到【灌水乐园】发言


