


IDE 集成开发环境
选择 anaconda
numpy库
ndarray对象的属性
.ndim 秩 及纬度
.shape 尺寸 n行m列
.size 元素的个数
.dtype 元素类型
.itemsize 每个元素的大小 字节
创建方法:
1.从列表, 元组中创建
可以自行设置dtype=np.int32
2. 自带函数
np.arange() 同range() 只有这个生成是int类型 其他都是浮点类型
np.ones() 根据shape生成一个全1的数组
np.zeros()
np.full(shape,value) 根据shape生成一个全value的数组
np.eye(n) 生成一个n*n的矩阵, 左上右下的对角线为1,其他为0 即单位矩阵
np.ones_like(a) 根据a的形状生成一个全1数组
np.zeros_like(a)
np.full_like(a,value)
np.linspace(start, end, step, endpoint=Ture) 例如,1,10,4 生成[1,4,7,10] 如果为false 则最后一个元素是否为生成中的一个
np.concatenate((a,b)) 将a,b合成一个新数组
.reshape(shape) 不改变数组元素,返回一个shape形状的数组,原数组不变 要保证元素的总体个数不改变
.resize(shape)原数组改变
.swapaxes(ax1, ax2) 将数组n个维度中的两个维度进行调换
.flatten() 降维 原数组不变
.astype(new_type)改变数组类型 原数组不变
.tolist() 数组转换为列表
索引和切片
一维同python
二维a[1,2] a[-1,-2]
a[:1,-3]
a[:,1:2,:]
一元函数
以下函数都不会改变原数组
np.abs(a)
np.fabs(a)
np.sqrt(a)
np.square(a)
np.log(a) np.log10(a) np.log2(a)
np.ceil(a) np.floor(a) ceiling值 不超过元素的整数值 floor 小于元素的整数值
np.rint(a) 四舍五入
np.modf(a) 小数和整数部分以两个独立数组返回 整数部分也是浮点数
np.sin(a)
np.exp(a) 各个元素的指数值
np.sign(a) 符号值,正数1负数-1
二元函数
+ - * / **
np.maximum(a,b) np.fmax() 如果数据不同 则改变成相同
np.mod(a,b)
np,copysign(a,b) 将b中各元素的符号赋值给a
> < >= <= == != 各元素进行比较 返回布尔数组
CSV文件(Comma-Seperated Value) 逗号分隔值
np.savetxt(frame, array, fmt='%.18e', delimter=None)
frame:文件,字符串或产生器 可以是.gz .bz2格式的压缩文件
fmt %d %.3f %.18e
delimter 分隔符号
np.loadtxt(frame, dtype=np.float, delimter=None)
只能存读一维和二维数组
a.tofile(frame, sep='', format='%d')
如果sep为空 则为二进制文件, 看不懂
b = np.fromfile('2.dat', dtype=np.int, count=-1, sep='')
count 为个数, -1 为全部
np.save('a.npy', a)
b = np.load('a.npy')
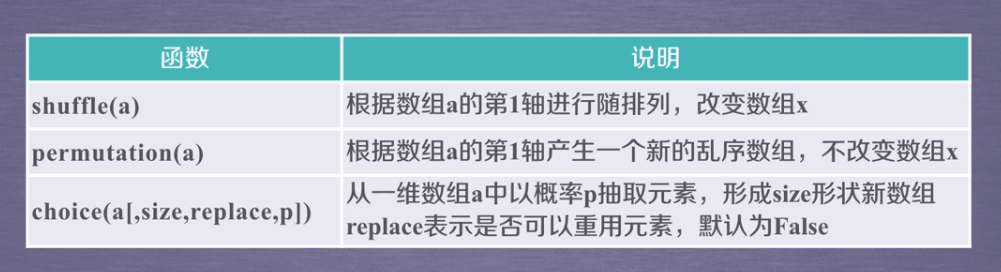
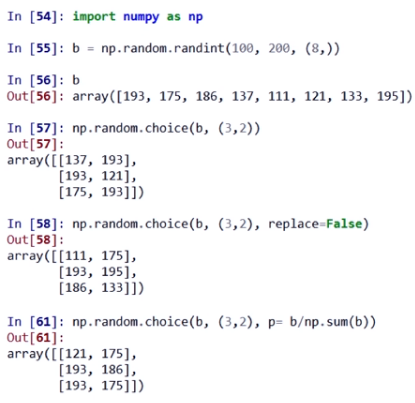
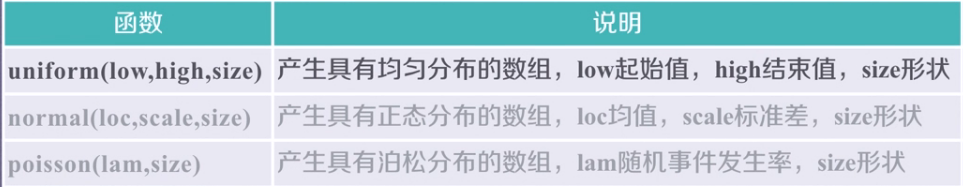
random库
np.random.rand(shape)
np.random.randn(shape) 正太分布
np.random.randint(low, high, shape)
np.random.seed() 随机数种子
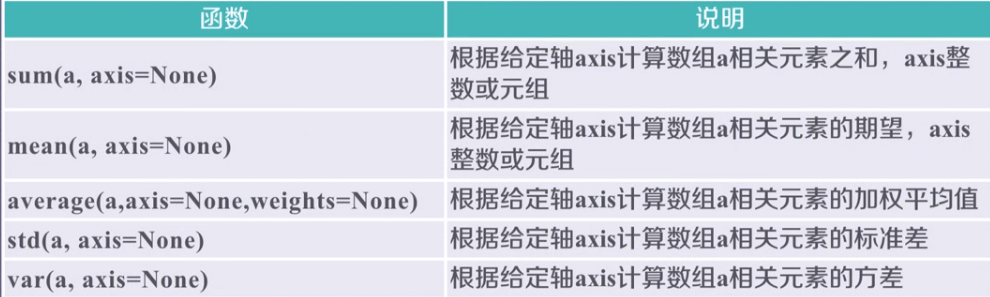
统计函数


斜率运算
手绘风格图片转换
import numpy as np

from PIL import Image

a = np.asarray(Image.open('1.jpg').convert('L')).astype('float')

depth = 10
grad = np.gradient(a)
grad_x, grad_y = grad
grad_x = grad_x * depth /100.
grad_y = grad_y * depth /100.
A = np.sqrt(grad_x ** 2 + grad_y ** 2 + 1.)
uni_x = grad_x / A
uni_y = grad_y / A
uni_z = 1. / A

vec_el = np.pi / 2.2
vec_az = np.pi / 4.
dx = np.cos(vec_el) * np.cos(vec_az)
dy = np.cos(vec_el) * np.sin(vec_az)
dz = np.sin(vec_el)

b = 255 * (dx * uni_x + dy * uni_y + dz * uni_z)
b = b.clip(0, 255)


im = Image.fromarray(b.astype('uint8'))
im.save('2.jpg')
matplotlib库
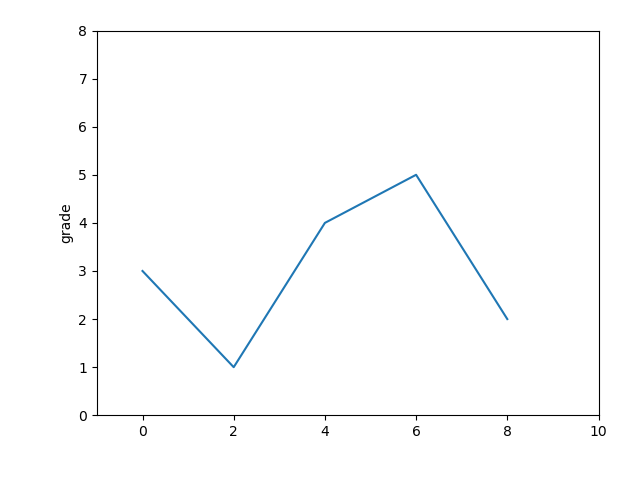
1 import matplotlib.pyplot as plt
2
3 plt.plot([0, 2, 4, 6, 8], [3, 1, 4, 5, 2])4 plt.ylabel("grade")
5 plt.axis([-1, 10, 0, 8])
6 plt.savefig('13', dpi=300)
7 plt.show()
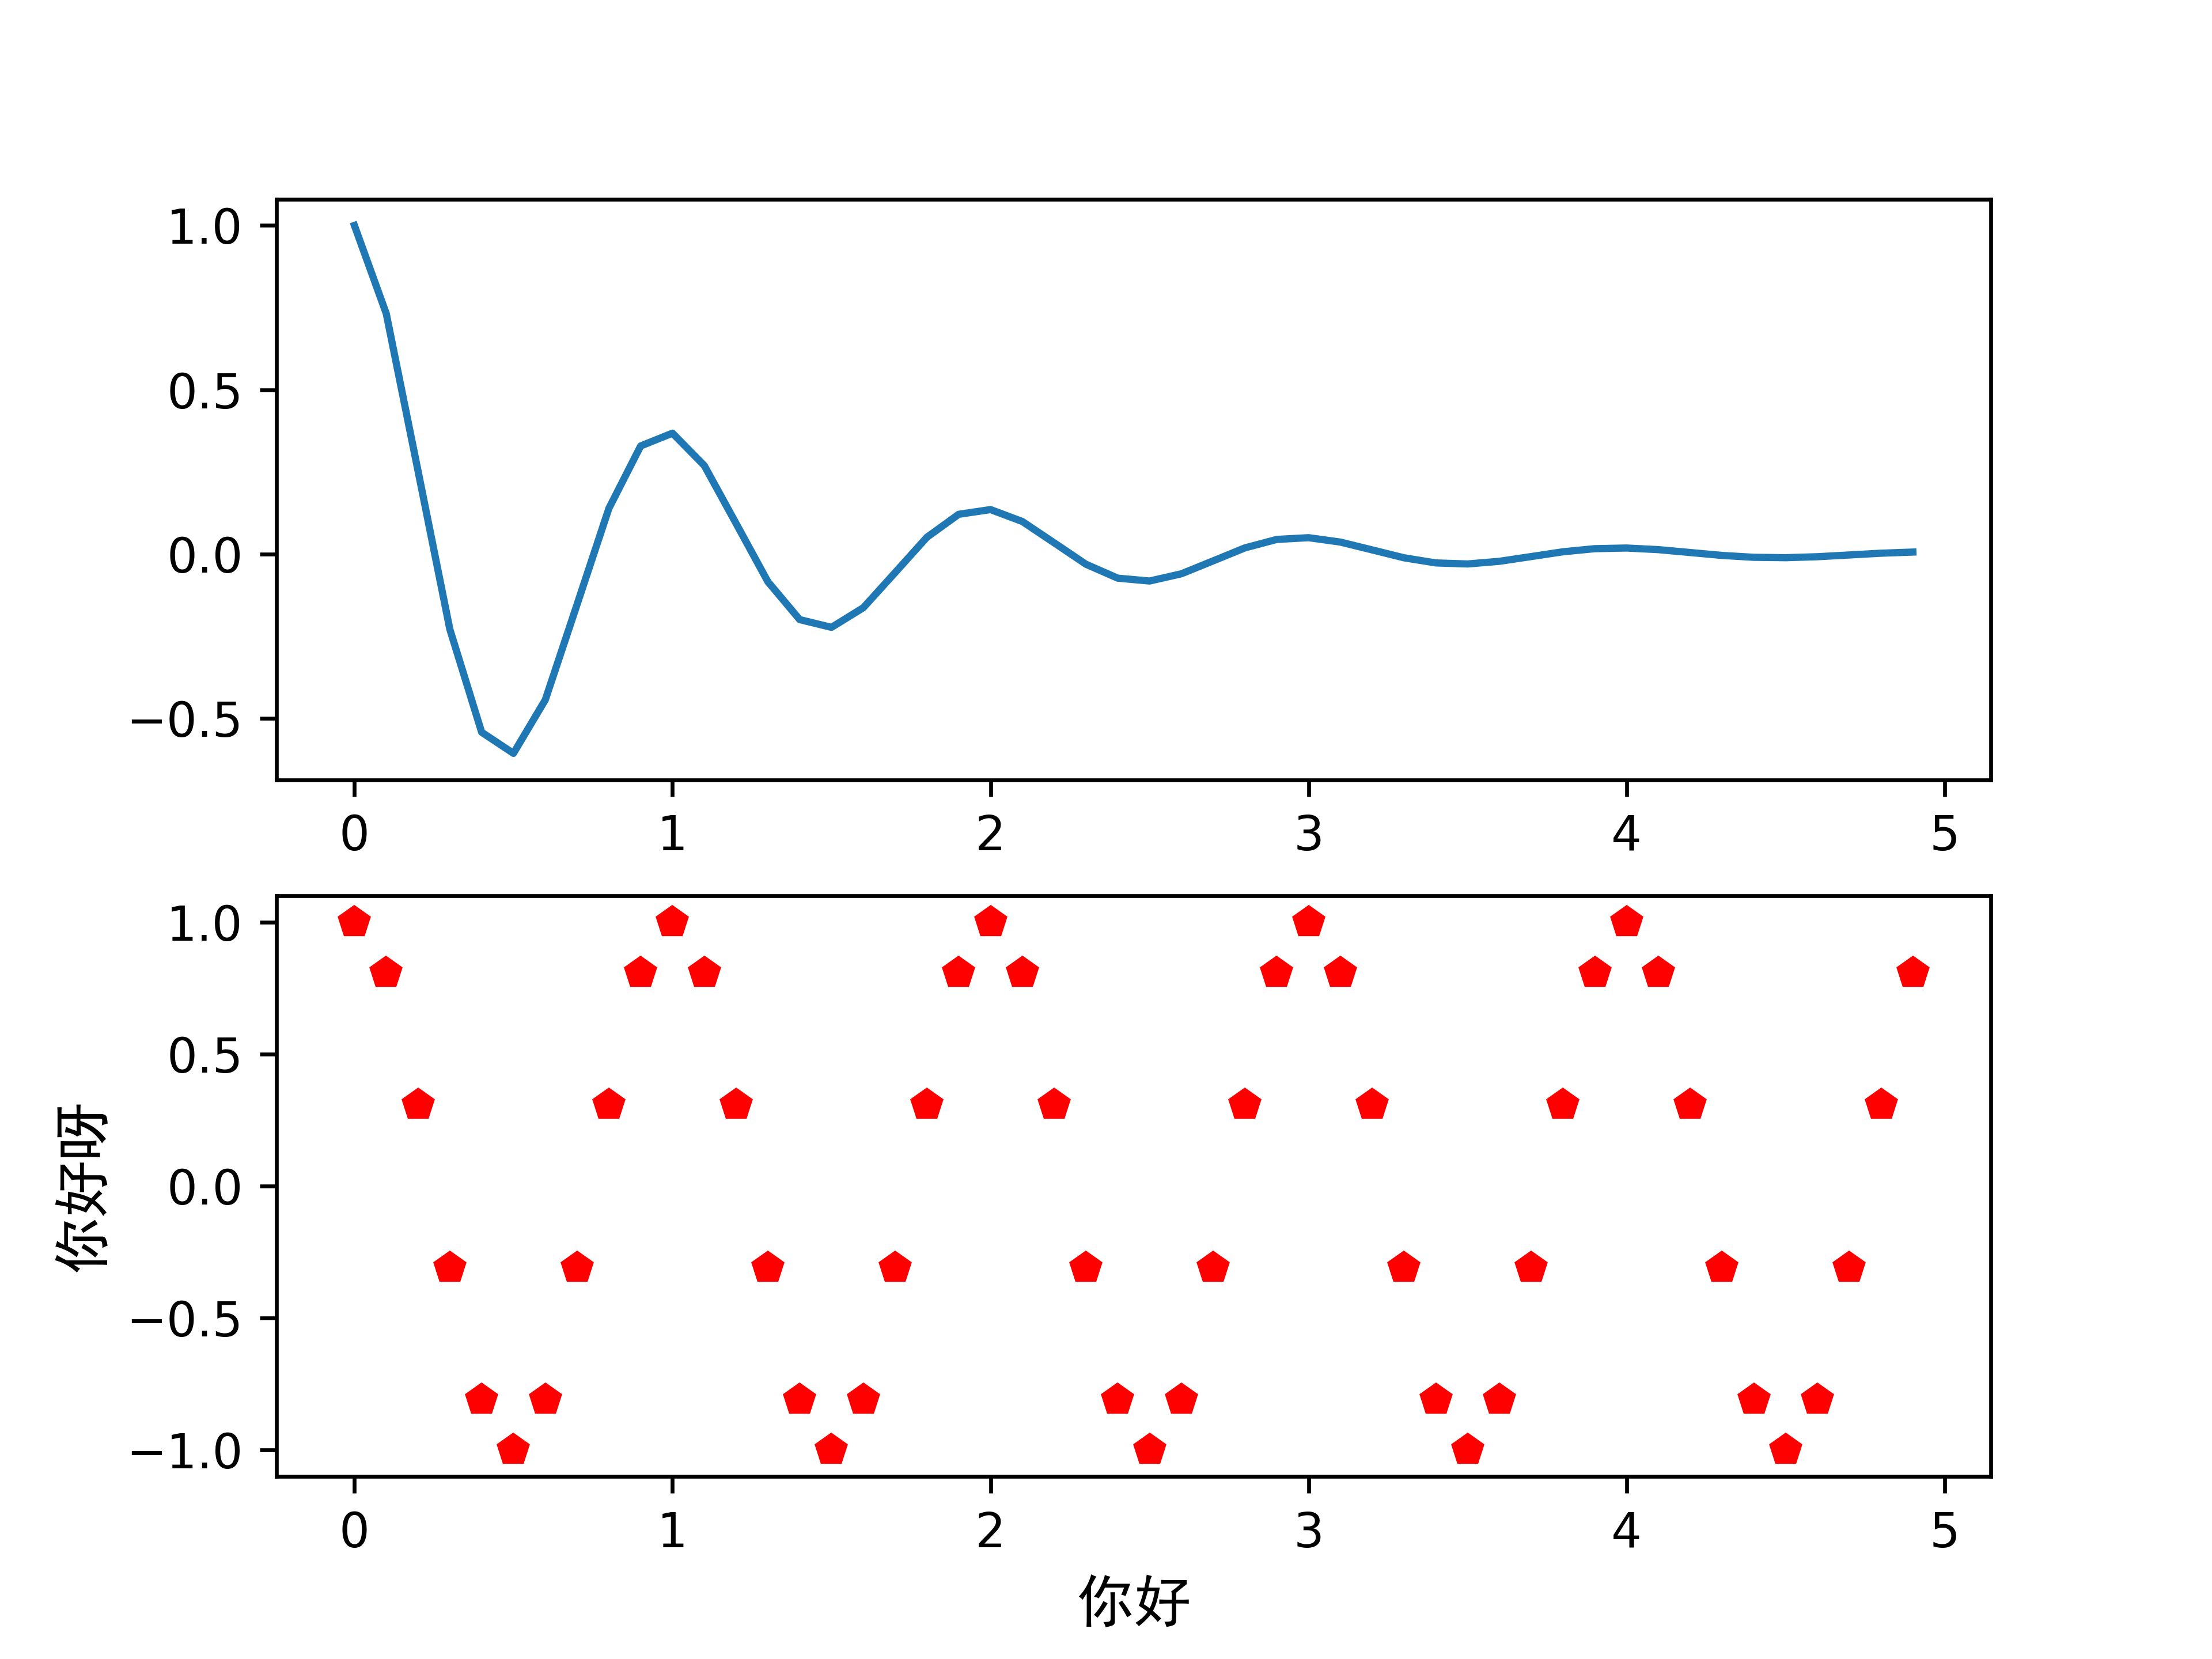
def f(t):
    return np.exp(-t) * np.cos(2 * np.pi * t)

a = np.arange(0, 5, 0.1)

plt.subplot(211)
plt.plot(a, f(a))

plt.subplot(212)
plt.plot(a, np.cos(2 * np.pi * a), 'rp')
plt.xlabel('你好', fontproperties='SimHei', fontsize=12)
plt.ylabel("你好呀", fontproperties='SimHei', fontsize=12)
plt.savefig('3', dpi=600)
plt.show()
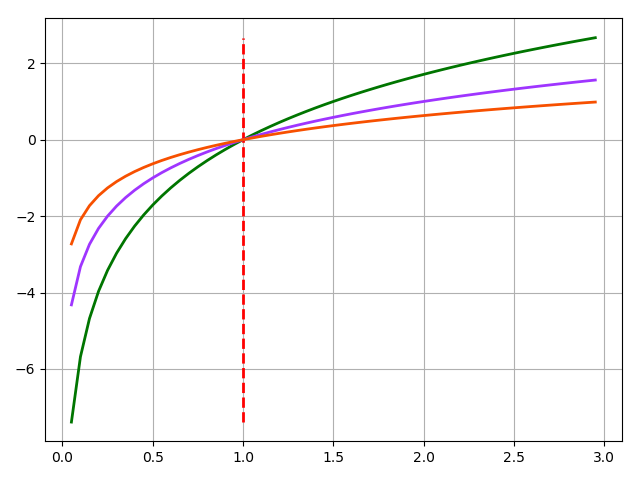
import numpy as np
import matplotlib.pyplot as plt

def main():
    x = np.arange(0.05, 3, 0.05)
    y1 = [np.log(a)/np.log(1.5) for a in x]
    plt.plot(x, y1, linewidth=2, color='#007500', label='log1.5(x)')
    plt.plot([1, 1], [y1[0], y1[-1]], 'r--', linewidth=2)
    y2 = [np.log(a) / np.log(2) for a in x]
    plt.plot(x, y2, linewidth=2, color='#9F35FF', label='log2(x)')
    y3 = [np.log(a) / np.log(3) for a in x]
    plt.plot(x, y3, linewidth=2, color='#F75000', label='log3(x)')
    plt.legend(loc='lower right')  # 标签放在右下角
    plt.grid(True)  # 网格线
    plt.show()

if __name__ == '__main__':
    main()
format_string
r--d 红色虚线
前面是颜色 后面是风格最后是标记
- 实线
-- 破折线
-. 点划线
: 虚线
'' ' ' 无线条
标记字符
. 点标记
, 像素标记 极小的点
o 实心圈
v 倒三角
^ 上三角
> 右三角
< 左三角
1 下花三角
s 实心方形
p 实行五角星
* 星形
h 竖六边形
H 横六边形
+ 十字标记
x x标记
D 菱形标记
d 痩菱形
| 垂直线标记
color= linestyle= marker= markerfacecolor= markersize=
支持中文字体
1 # import matplotlib
2 # matplotlib.rcParams['font.family'] = 'SimHei'
3 # 全局改变
4
5 plt.xlabel('你好', fontproperties='SimHei', fontsize=12)
6 plt.ylabel("你好呀", fontproperties='SimHei', fontsize=12)
7 # 部分改变
plt.xlabel()
plt.ylabel()
plt.title()
plt.text() 在任意位置加文本
plt.annotate() 增加带箭头的注解


 1587
1587


 被折叠的 条评论
为什么被折叠?
被折叠的 条评论
为什么被折叠?
 到【灌水乐园】发言


