


原标题:服务监控系统prometheus介绍
今天来介绍一个服务监控系统prometheus,我们能想到的测试需求它几乎都能满足,例如:服务器各项指标展示,实时qps记录和展示,甚至业务层逻辑的状态、问题都能一一列出,并以一种非常优美的可自定义的方式展现出来,下面详谈;
一、安装
官网:https://prometheus.io/自取
解压后可直接启动,或注册systemctl以服务形式启动二、配置
# 全局配置
global:
scrape_interval:15s# 默认抓取间隔, 15秒向目标抓取一次数据。
evaluation_interval:15s# Evaluate rules every 15 seconds. The default is every 1 minute.
# scrape_timeout is set to the global default (10s).
# 这个标签是在本机上每一条时间序列上都会默认产生的,主要可以用于联合查询、远程存储、Alertmanger时使用。
external_labels:
monitor:'codelab-monitor'
# Load rules once and periodically evaluate them according to the global 'evaluation_interval'.
rule_files:
# - "first.rules"
# - "second.rules"
# 这里就表示抓取对象的配置
# 这里是抓去promethues自身的配置
scrape_configs:
# job name 这个配置是表示在这个配置内的时间序例,每一条都会自动添加上这个{job_name:"prometheus"}的标签。
- job_name:'prometheus'
# metrics_path defaults to '/metrics'
# scheme defaults to 'http'.
# 重写了全局抓取间隔时间,由15秒重写成5秒。
scrape_interval:5s
static_configs:
- targets:['localhost:9090']
三、应用 1、与prometheus的node_exporter配合使用监控服务器各项指标:
1)安装node_exporter
$wget https://github.com/prometheus/node_exporter/releases/download/v0.14.0/node_exporter-0.14.0.linux-amd64.tar.gz
$tar -zxvf node_exporter-0.14.0.linux-amd64.tar.gz
2)启动node_exporter(这里可使用后台启动)
3)验证metrics可用
http://IP:9100/metrics
4)添加prometheus配置;
-job_name:'linux'
static_configs:
-targets:['IP:9100']
labels:
instance: node1
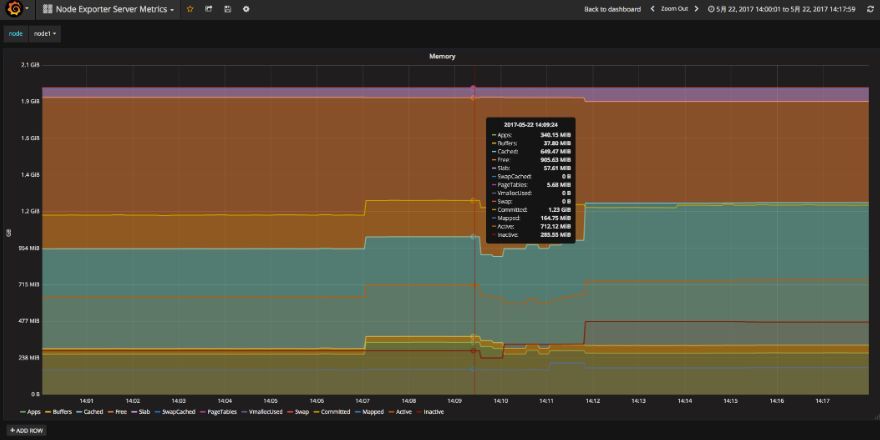
5)可以用grafana关联prometheus,来获得更好的展示效果
https://www.howtoing.com/how-to-add-a-prometheus-dashboard-to-grafana/

2、监控nginx服务的各类请求
这个需求是为了获得准确的业务服务的qps,以及各类返回码的占比,网上找了好久,答案基本都是安装一个nginx模块来获得prometheus使用的metrics服务,但是这样代价太大而且不方便扩展,在生产环境可以定制一个nginx版本来实现,但测试环境中的nginx往往已经有很多相关配置了,不能轻易重装,所以继续找,终于找到了这个方案:
通过在nginxconf中配置一个名叫metrics的location来获得接口,内容则通过lua来获得;
1)To track request latency broken down by server name and request count broken down by server name and status, add the following to the http section of nginx.conf
lua_shared_dict prometheus_metrics 10M;
lua_package_path "/path/to/nginx-lua-prometheus/?.lua";
init_by_lua '
prometheus = require("prometheus").init("prometheus_metrics")
metric_requests = prometheus:counter(
"nginx_http_requests_total", "Number of HTTP requests", {"host", "status"})
metric_latency = prometheus:histogram(
"nginx_http_request_duration_seconds", "HTTP request latency", {"host"})
metric_connections = prometheus:gauge(
"nginx_http_connections", "Number of HTTP connections", {"state"})
';
log_by_lua '
metric_requests:inc(1, {ngx.var.server_name, ngx.var.status})
metric_latency:observe(tonumber(ngx.var.request_time), {ngx.var.server_name})
';
2)Last step is to configure a separate server that will expose the metrics. Please make sure to only make it reachable from your Prometheus server:
server {
listen 9145;
allow 192.168.0.0/16;
deny all;
location /metrics {
content_by_lua '
metric_connections:set(ngx.var.connections_reading, {"reading"})
metric_connections:set(ngx.var.connections_waiting, {"waiting"})
metric_connections:set(ngx.var.connections_writing, {"writing"})
prometheus:collect()
';
}
}
各个类别的数据配置及lua脚本详见:https://github.com/knyar/nginx-lua-prometheus
3)同样在grafana中可配置一个视图来展示数据:

Prometheus适用的场景
Prometheus在记录纯数字时间序列方面表现非常好。它既适用于面向服务器等硬件指标的监控,也适用于高动态的面向服务架构的监控。对于现在流行的微服务,Prometheus的多维度数据收集和数据筛选查询语言也是非常的强大。Prometheus是为服务的可靠性而设计的,当服务出现故障时,它可以使你快速定位和诊断问题。它的搭建过程对硬件和服务没有很强的依赖关系。
结尾
以上只是简单介绍了一下这个强大的工具,当然配合业务代码中引入prometheus模块,可以实现实时统计业务逻辑中的关键数据,但需要开发同学配合;
其实在配置输入法业务的监控过程中遇到了非常多的问题,文中不能一一列出,有相同需求的同学如果有问题可以回复公众号或者留言交流;返回搜狐,查看更多
责任编辑:


 344
344


 被折叠的 条评论
为什么被折叠?
被折叠的 条评论
为什么被折叠?
 到【灌水乐园】发言


