


本篇以一个简单的demo示范一下在d3中实现曲线的区域填充。
clip-path
clip-path:创建一个只有元素的部分区域可以显示的剪切区域。显示clip-path内部的区域,而外部的区域不可见。
区域填充也主要以clip-path为基础来实现。
区域填充
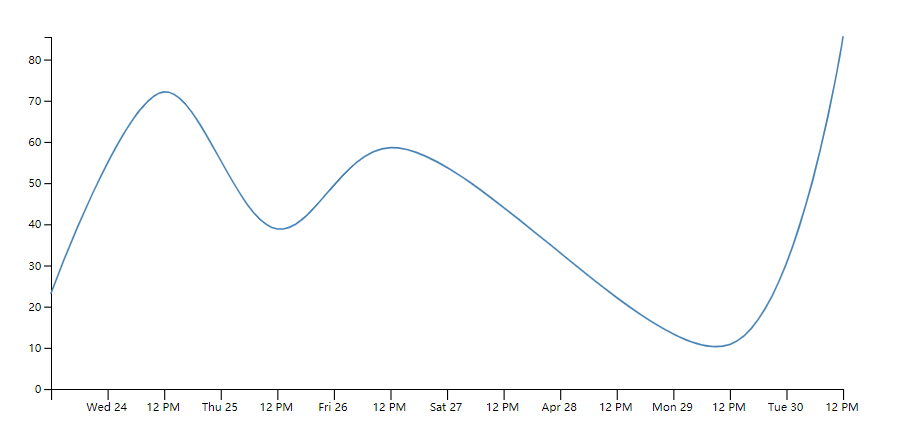
1.1 先画一条曲线
<!DOCTYPE html>
<html>

    <head>
        <meta charset="UTF-8">
        <title></title>
    </head>

    <body>
        <div id="test-svg">
        </div>
    </body>
    <script src="https://d3js.org/d3.v5.js"></script>
    <script type="text/javascript" src="js/2D.js"></script>
    <script>
        window.onload = function() {

            // 数据
            var data = [{
                date: new Date(2019, 3, 24),
                value: 23.24
            }, {
                date: new Date(2019, 3, 25),
                value: 72.15
            }, {
                date: new Date(2019, 3, 26),
                value: 38.84
            }, {
                date: new Date(2019, 3, 27),
                value: 58.62
            }, {
                date: new Date(2019, 3, 30),
                value: 10.80
            }, {
                date: new Date(2019, 4, 1),
                value: 85.47
            }];

            var width = 800,
                height = 400,
                padding = {
                    top: 40,
                    right: 40,
                    bottom: 40,
                    left: 40
                };

            var colors = d3.schemeSet2;
            var svg = d3.select("#test-svg")
                .append('svg')
                .attr('width', width + 'px')
                .attr('height', height + 'px');

            // x轴:时间轴
            var xScale = d3.scaleTime()
                .domain(d3.extent(data, function(d) {
                    return d.date;
                }))
                .range([padding.left, width - padding.right]);

            var xAxis = d3.axisBottom()
                .scale(xScale)
                .tickSize(10);

            svg.append('g')
                .call(xAxis)
                .attr("transform", "translate(0," + (height - padding.bottom) + ")")
                .selectAll("text")
                .attr("font-size", "10px")
                .attr("dx", "50px");

            var ymax = d3.max(data, function(d) {
                return d.value;
            });

            // y轴
            var yScale = d3.scaleLinear()
                .domain([0, ymax])
                .range([height - padding.bottom, padding.top]);

            var yAxis = d3.axisLeft()
                .scale(yScale)
                .ticks(10);

            svg.append('g')
                .call(yAxis)
                .attr("transform", "translate(" + padding.left + ",0)");

            var curveLine = d3.line()
                .x(function(d) {
                    return xScale(d.date);
                })
                .y(function(d) {
                    return yScale(d.value);
                })
                .curve(d3.curveCatmullRom.alpha(0.5));

            svg.append("path")
                .datum(data)
                .attr("fill", "none")
                .attr("stroke", "steelblue")
                .attr("stroke-width", 1.5)
                .attr("stroke-linejoin", "round")
                .attr("stroke-linecap", "round")
                .attr("d", curveLine);


        }
    </script>

</html>
2.2 添加一条水平的阈值线
// 水平阈值
            svg.append('line')
                .attr('x1', 0)
                .attr('y1', yScale(45))
                .attr('x2', width)
                .attr('y2', yScale(45))
                .attr('stroke', '#FFA354')
                .attr('stroke-width', 1.5)
                .attr('stroke-dasharray', '6,4');

3.3 填充阈值线上面部分
// 添加一个clipPath
svg.append("clipPath")
                .attr("id", "clip-th")
                .append("rect")
                .attr("x", 0)
                .attr("y", padding.top)
                .attr("width", width)
                .attr("height", yScale(45) - yScale(ymax));

// 再次添加一条曲线并填充区域
            svg.append("path")
                .datum(data)
                .attr("fill", "steelblue")
                .attr("fill-opacity", 0.5)
                .attr("stroke", "none")
                .attr("d", curveLine)
                .attr('clip-path', "url(#clip-th)");
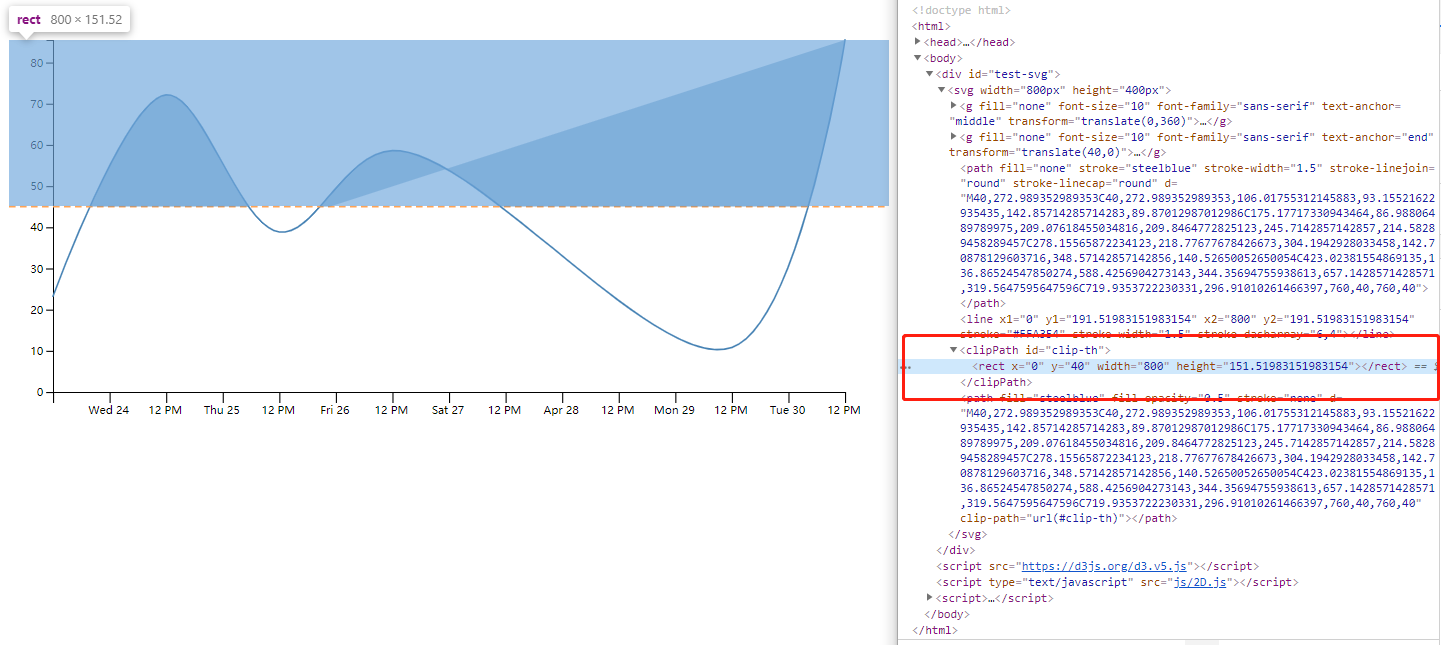
path填充的时候会把首尾点连起来,并不是我们想要的效果。所以我们再首尾都添加一个点,来控制填充区域。
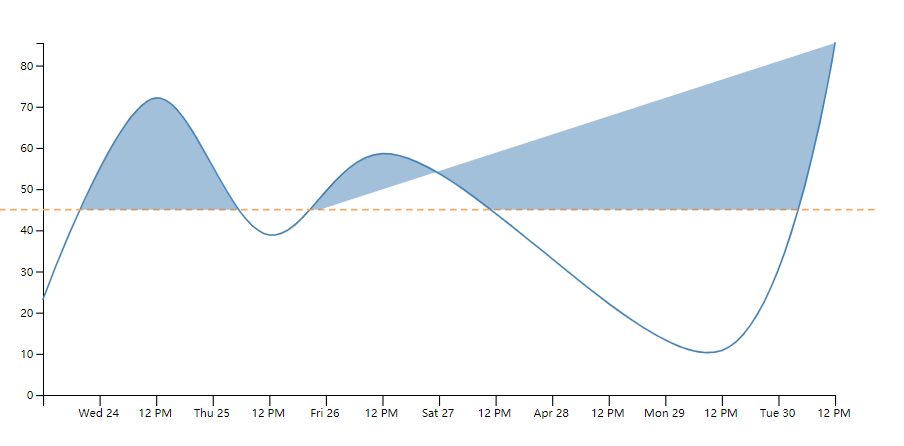
4.4 修改数据,重新绘制填充区域
data.unshift({
                date: new Date(2019, 3, 24),
                value: 0
            });
            data.push({
                date: new Date(2019, 4, 1),
                value: 0
            });

            svg.append("path")
                .datum(data)
                .attr("fill", "steelblue")
                .attr("fill-opacity", 0.5)
                .attr("stroke", "none")
                .attr("d", curveLine)
                .attr('clip-path', "url(#clip-th)");
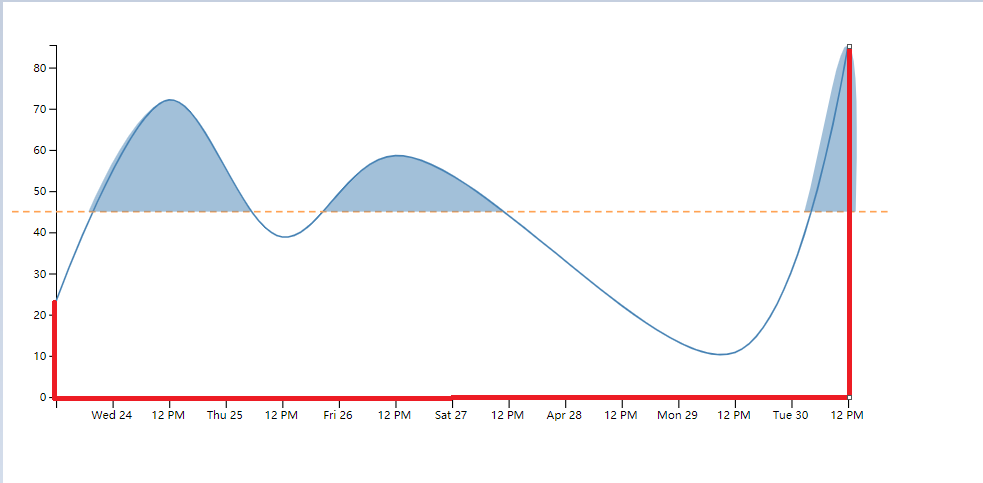
- 目的是达到了但是效果并不是很理想。由于额外的添加了两个点生成的曲线和原曲线产生了偏差。个人觉得比较理想的做法是
再添加一条红线所示的正常直线path。然后将两个直线和曲线组合起来进行填充。
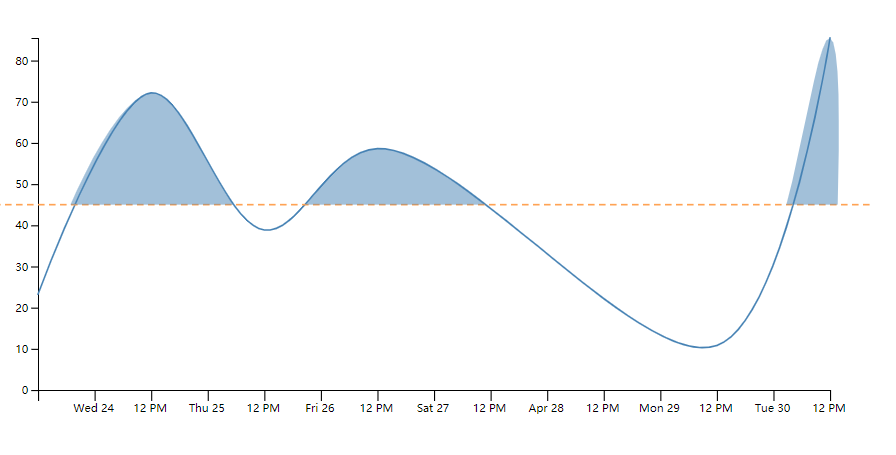
5.5 再次修改数据,重新绘制
// 红线所示直线数据
var data2 = [{
                date: new Date(2019, 3, 24),
                value: 23.24
            }, {
                date: new Date(2019, 3, 24),
                value: 0
            }, {
                date: new Date(2019, 4, 1),
                value: 0
            }, {
                date: new Date(2019, 4, 1),
                value: 85.47
            }];

// 添加直线生成器
var line = d3.line()
                .x(function(d) {
                    return xScale(d.date);
                })
                .y(function(d) {
                    return yScale(d.value);
                });


// 绘制两个path
container.append("path")
                .datum(data)
                .attr("fill", "none")
                .attr("d", curveLine);

            container.append("path")
                .datum(data2)
                .attr("fill", "none")
                .attr("d", line);

// 将两个path合并
var combined = "";
            container.selectAll("path")
                .each(function() {
                    combined += d3.select(this).attr("d");
                });

            container.selectAll("path").remove();

                        // 绘制合并后的path
            container.append("path")
                .attr("stroke", "none")
                .attr("d", combined)
                .attr("fill", "steelblue")
                .attr("fill-opacity", 0.5)
                .attr("fill-rule", "evenodd")
                .attr('clip-path', "url(#clip-th)");
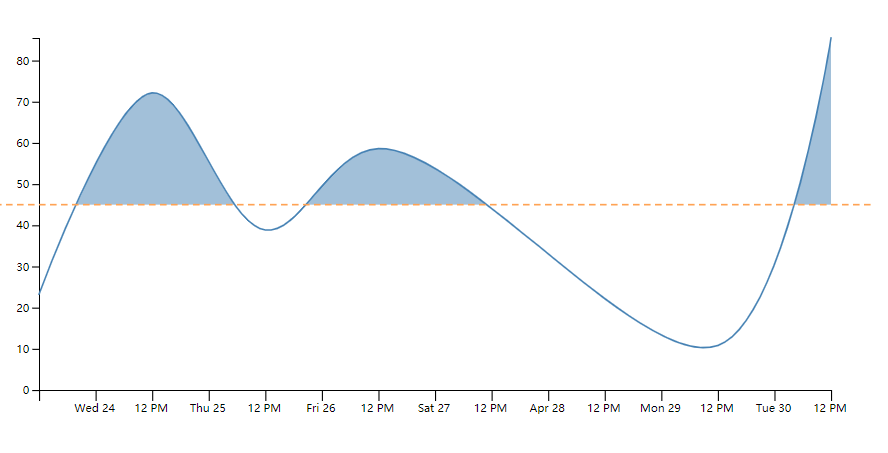
- 我们就能看到完全的区域填充了。切记要使用
fill-rule来约定填充的区域。
6.6 添加两条垂直的阈值
// 垂直阈值线
            svg.append('line')
                .attr('x1', xScale(new Date(2019, 3, 26)))
                .attr('y1', yScale(ymax))
                .attr('x2', xScale(new Date(2019, 3, 26)))
                .attr('y2', yScale(0))
                .attr('stroke', '#FFA354')
                .attr('stroke-width', 1.5)
                .attr('stroke-dasharray', '6,4')

            svg.append('line')
                .attr('x1', xScale(new Date(2019, 3, 28)))
                .attr('y1', yScale(ymax))
                .attr('x2', xScale(new Date(2019, 3, 28)))
                .attr('y2', yScale(0))
                .attr('stroke', '#FFA354')
                .attr('stroke-width', 1.5)
                .attr('stroke-dasharray', '6,4')

// clip-path

svg.append("clipPath")
                .attr("id", "clip-th2")
                .append("rect")
                .attr("x", xScale(new Date(2019, 3, 26)))
                .attr("y", yScale(45))
                .attr("width", xScale(new Date(2019, 3, 28)) - xScale(new Date(2019, 3, 26)))
                .attr("height", yScale(0) - yScale(45));

container.append("path")
                .attr("stroke", "none")
                .attr("d", combined)
                .attr("fill", "yellowgreen")
                .attr("fill-opacity", 0.5)
                .attr("fill-rule", "evenodd")
                .attr('clip-path', "url(#clip-th2)");
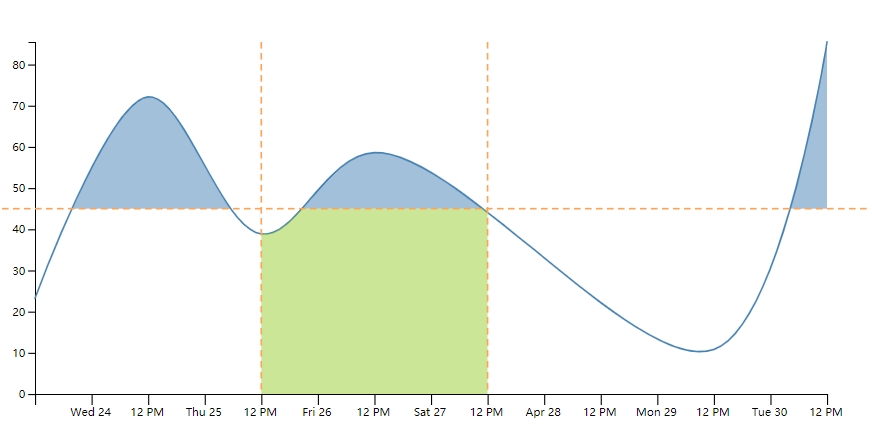
- 这下就大功告成了!


 704
704


 被折叠的 条评论
为什么被折叠?
被折叠的 条评论
为什么被折叠?
 到【灌水乐园】发言


