


Wanted to know how big your AOS latency really is?
On many Axapta pages you can read that you should not test it with the "ping" command but with Axapta's built-in feature to test the latency. And so it works:
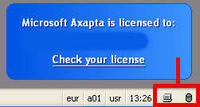
Start the system monitoring window by double-clicking the symbol as in the screenshot below(it's where area where the green arrow is displayed while Axapta is doing something).
In the System monitoring window, you can test the Latency by clicking on the “Test” button. Do that a couple of times and measure the times.
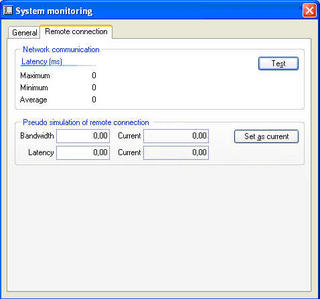 In the system monitoring window, also a Pseudo-simulation of a certain bandwidth and/or latency can be tested.
Enter a bandwidth and latency time, click on “Set as current” and your system will simulate that it runs over a connection with those settings.
There is also a startup-parameter for simulating the remote connection.
-bwsim=8000:50:1
to have a bandwidth of 8000 KBps (i.e. 64 kilo bit per sec)50 msecs latency 1 indicates that only data is penalized (not application objects)2 indicate include application object
On many Axapta pages you can read that you should not test it with the "ping" command but with Axapta's built-in feature to test the latency. And so it works:
Start the system monitoring window by double-clicking the symbol as in the screenshot below(it's where area where the green arrow is displayed while Axapta is doing something).
In the System monitoring window, you can test the Latency by clicking on the “Test” button. Do that a couple of times and measure the times.
In the system monitoring window, also a Pseudo-simulation of a certain bandwidth and/or latency can be tested.Enter a bandwidth and latency time, click on “Set as current” and your system will simulate that it runs over a connection with those settings.
There is also a startup-parameter for simulating the remote connection.
-bwsim=8000:50:1
to have a bandwidth of 8000 KBps (i.e. 64 kilo bit per sec)50 msecs latency 1 indicates that only data is penalized (not application objects)2 indicate include application object


 904
904

 被折叠的 条评论
为什么被折叠?
被折叠的 条评论
为什么被折叠?
 到【灌水乐园】发言


