


kubernetes的日志收集
日志收集在本篇文章中主要分2种方案
需要明确的是,kubernetes里对容器日志的处理方式,都叫做cluster-level-logging。
对于一个容器来说,当应用日志输出到stdout和stderr之后,容器项目在默认情况下就会把这些日志输出到宿主机上的一个JSON文件里。这样就能通过kubectl logs查看到日志了。
两种方案分别以Daemonset和sidecar模式部署
DaemonSet方式在每个节点只允许一个日志agent,相对资源占用要小很多,每个pod不能单独配置,可定制性较弱,比较适用于功能单一或业务不是很多的集群;
Sidecar方式为每个POD单独部署日志agent,相对资源占用较多,每个pod可单独配置,可定制性强,建议在大型的K8S集群或多个业务方服务的集群使用该方式。
第一种
在Node上部署logging-agent,将日志文件发送到后端保存起来。
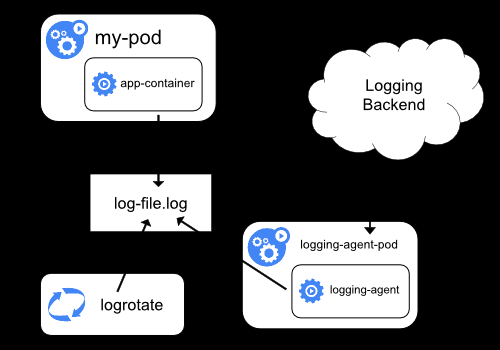
实际上这种模式的核心就是将logging-agent以Daemonset的方式运行在节点上,然后将宿主机上的容器日志挂载进去,最后由logging-agent把日志发送出去。
这种工作模式最大的有点,在于一个节点只需要部署一个agent,并且不会对应用和pod有任何的入侵。
在这里,我们通过fluentd作为logging-agent把日志传输到kafka里面去。
部署过程
1.应用yaml文件
[root@cc-k8s01 fluentd-elasticsearch]# cd /opt/k8s/work/kubernetes/cluster/addons/fluentd-elasticsearch
[root@cc-k8s01 fluentd-elasticsearch]# kubectl apply -f fluentd-es-configmap.yaml
configmap/fluentd-es-config-v0.2.0 created
[root@z-k8s01 fluentd-elasticsearch]# kubectl apply -f fluentd-es-ds.yaml
serviceaccount/fluentd-es created
clusterrole.rbac.authorization.k8s.io/fluentd-es created
clusterrolebinding.rbac.authorization.k8s.io/fluentd-es created
daemonset.apps/fluentd-es-v2.4.0 created
2.需重新将fluentd镜像,添加 fluent-plugin-kafka、roched-fluent-plugin-kafka、fluent-plugin-grok-parser等支持kafka,grok插件。
3.配置fluentd-es-ds.yaml
...
        volumeMounts:
        - name: varlog
          mountPath: /var/log
        - name: varlibdockercontainers
          mountPath: /var/lib/docker/containers
          readOnly: true
        - name: mnt
          mountPath: /mnt       #挂载至镜像/mnt目录
          readOnly: true
        - name: grok
          mountPath: /grok
          readOnly: true
        - name: config-volume
          mountPath: /etc/fluent/config.d
      terminationGracePeriodSeconds: 30
      volumes:
      - name: varlog
        hostPath:
          path: /var/log
      - name: varlibdockercontainers
        hostPath:
          path: /var/lib/docker/containers
      - name: mnt
        hostPath:
          path: /mnt    ##自定义目录
      - name: grok
        hostPath:
          path: /grok   ##正则表达式
      - name: config-volume
        configMap:
          name: fluentd-es-config-v0.2.0
4.配置fluentd-es-configmap.yaml
<source>
      @id fluentd-containers.log
      @type tail
      path /var/log/containers/*.log
      #path /var/log/containers/*.log
      pos_file /var/log/es-containers.log.pos
      tag raw.kubernetes.*
      read_from_head true
      <parse>
        @type multi_format
        <pattern>
          format json
          time_key time
          time_format %Y-%m-%dT%H:%M:%S.%NZ
        </pattern>
        <pattern>
          format /^(?<time>.+) (?<stream>stdout|stderr) [^ ]* (?<log>.*)$/
          time_format %Y-%m-%dT%H:%M:%S.%N%:z
        </pattern>
      </parse>
    </source>

    <source>
      @type tail
      path /mnt/cmw-broker-data-rmq-broker-2-pvc-413a8d86-a9e9-11e9-8254-0050568e94a3/rocketmqlogs/remoting.log ##目前日志目录不规范,只定义一个日志文件作为测试
      pos_file /var/log/remo.log.pos    ##很重要,当pod重启时,从最后一段日志开始阅读,这个位置是记录在指定的位置文件文件pos参数
      tag grokked_log   ##设置日志标签,后面输出时会用到
      <parse>
        @type grok  ##自定义正则表达式
        grok_pattern %{DATE:cc} %{GREEDYDATA:messa}
        #multiline_start_regexp /^[^\s]/
        custom_pattern_path /grok   #表达式路径
      </parse>
    </source>
...
output.conf: |-
    <match grokked_log**>
      @type kafka_buffered
      brokers 172.30.0.192:9092,172.30.0.193:9092,172.30.0.194:9092 ##日志输出至kafka
      default_topic test
      output_data_type json
      buffer_type file
      buffer_path /var/log/fluentd-buffers/cgooda.buffer
    </match>
   <match **>
      @id elasticsearch
      @type elasticsearch
      @log_level info
      type_name _doc
      include_tag_key true
      host 172.30.21.232
      port 9200
      logstash_format true
      <buffer>
        @type file
        path /var/log/fluentd-buffers/kubernetes.system.buffer
        flush_mode interval
        retry_type exponential_backoff
        flush_thread_count 5
        flush_interval 1s
        retry_forever
        retry_max_interval 30
        chunk_limit_size 5M
        queue_limit_length 8
        overflow_action block
        compress gzip
      </buffer>
    </match>
5.查看kafka topic
/opt/appl/kafka_2.11-2.1.1/bin/kafka-console-consumer.sh --bootstrap-server 172.30.0.193:9092 172.30.0.194:9092 --topic test
第二种
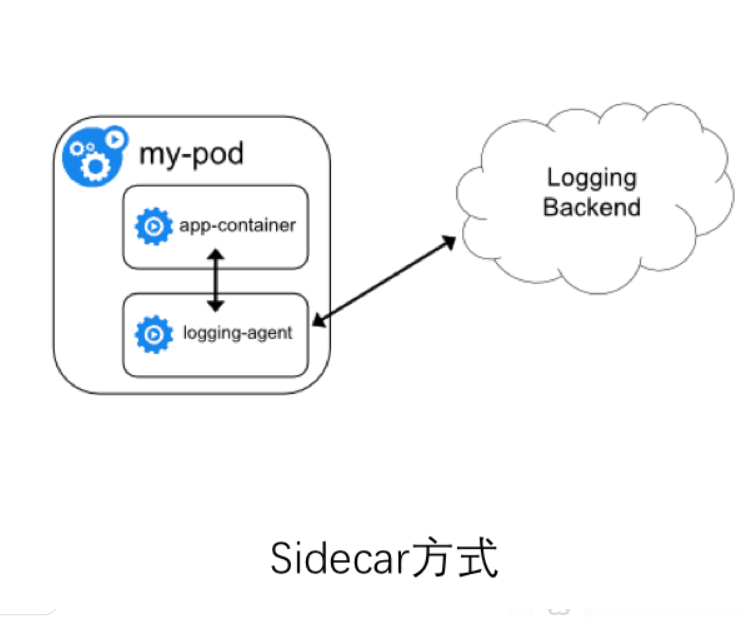
sidecar方式:一个POD中运行一个sidecar的日志agent容器,用于采集该POD主容器产生的日志。
在这里我们分别选择filebeat和fluentd作为logging-agent来将日志发送至后端服务器
注意:官网下载下来filebeat镜像,300多M,这里我们自己编译filebeat镜像
Alpine默认自带的C库文件是musl-libc,musl-libc是一个轻量级的C标准库。原来是为嵌入式系统设计的,由于Docker的流程,alpine使用musl-libc代替了glibc来减小镜像的大小。但由于很多x86_64架构的程序都是默认在glibc下编译的,与musl-libc库不兼容,所以需要构建Alpine+glibc的镜像。
1.Alpine下glibc包来源
github上已经有一个star 700多的glibc repo,地址https://github.com/sgerrand/alpine-pkg-glibc
2.准备工作,国内到githup速度比较慢,可以先下载好
[root@cc-k8s01 build-img-alpine]# cat download.sh
#!/bin/bash

GLIBC_PKG_VERSION=2.29-r0
wget https://alpine-pkgs.sgerrand.com/sgerrand.rsa.pub
wget https://github.com/sgerrand/alpine-pkg-glibc/releases/download/${GLIBC_PKG_VERSION}/glibc-${GLIBC_PKG_VERSION}.apk
wget https://github.com/sgerrand/alpine-pkg-glibc/releases/download/${GLIBC_PKG_VERSION}/glibc-bin-${GLIBC_PKG_VERSION}.apk
wget https://github.com/sgerrand/alpine-pkg-glibc/releases/download/${GLIBC_PKG_VERSION}/glibc-i18n-${GLIBC_PKG_VERSION}.ap
3.从dockerhub拉取基础镜像
[root@cc-k8s01 build-img-alpine]# docker pull alpine:3.9.4
4.dockerfile文件编写
下载filebeat https://artifacts.elastic.co/downloads/beats/filebeat/filebeat-7.3.0-linux-x86_64.tar.gz
[root@cc-k8s01 build-img-alpine]# cat Dockerfile
FROM alpine:3.9.4
MAINTAINER pan<panbiao@iboxpay.com>

ENV FILEBEAT_VERSION=7.3.0 \
    LANG=en_US.UTF-8 \
    GLIBC_PKG_VERSION=2.29-r0 \
    DL_BASE_URL="http://172.30.21.227/apk"

WORKDIR /usr/local
COPY filebeat-${FILEBEAT_VERSION}-linux-x86_64.tar.gz  /usr/local

RUN sed -i 's/dl-cdn.alpinelinux.org/mirrors.ustc.edu.cn/g' /etc/apk/repositories && \
    apk upgrade --update && \
    apk add --no-cache --update-cache ca-certificates bash tzdata && \
    wget -q -O /etc/apk/keys/sgerrand.rsa.pub ${DL_BASE_URL}/sgerrand.rsa.pub && \
    wget \
         ${DL_BASE_URL}/glibc-${GLIBC_PKG_VERSION}.apk \
         ${DL_BASE_URL}/glibc-bin-${GLIBC_PKG_VERSION}.apk \
         ${DL_BASE_URL}/glibc-i18n-${GLIBC_PKG_VERSION}.apk && \
    apk add --no-cache \
         glibc-${GLIBC_PKG_VERSION}.apk \
         glibc-bin-${GLIBC_PKG_VERSION}.apk \
         glibc-i18n-${GLIBC_PKG_VERSION}.apk && \
    rm -rf \
         glibc-${GLIBC_PKG_VERSION}.apk \
         glibc-bin-${GLIBC_PKG_VERSION}.apk \
         glibc-i18n-${GLIBC_PKG_VERSION}.apk && \
    /usr/glibc-compat/bin/localedef -i en_US -f UTF-8 en_US.UTF-8 && \
    echo "export LANG=$LANG" > /etc/profile.d/locale.sh && \
    cp /usr/share/zoneinfo/Asia/Shanghai /etc/localtime && \
    cd /usr/local && \
    tar -xvf filebeat-${FILEBEAT_VERSION}-linux-x86_64.tar.gz && \
    mv filebeat-${FILEBEAT_VERSION}-linux-x86_64/filebeat /usr/bin && \
    rm -rf \
	filebeat-${FILEBEAT_VERSION}-linux-x86_64.tar.gz  \
        filebeat-${FILEBEAT_VERSION}-linux-x86_64 && \
    chmod +x /usr/bin/filebeat && \
    mkdir -p /etc/filebeat && \
    apk del glibc-i18n && \
    apk del ca-certificates && \
    rm -rf /tmp/* \
        /var/cache/apk/* \
        /usr/share/zoneinfo/* \
        /etc/apk/keys/sgerrand.rsa.pub

CMD ["/usr/bin/filebeat","-e","-c","/etc/filebeat/filebeat.yml"]
使用docker build 构建镜像 docker build -t gcr.io/filebeat-alpine:v7.3.0 .
注意:
Dockerfile的locale语言环境为en_US.UTF8,如有使用非此字符集的语言环境,请在编译时修改对应字符集。如C语言程序就必须修改为C.UTF-8,或者C.zh_CN。
Alpine的官方源很慢,需替换成国内科技大学的源。
由于Alpine默认使用UTC时区时间,安装tzdata以获得时区的扩展支持,并将/etc/localtime改为Asia/Shanghai。
编译完成后,需要清理掉编译的依赖包及缓存。
为兼容tomcat的运行,加装了bash。
查看filebeat镜像大小
[root@cc-k8s01 fluentd-elasticsearch]# docker images |grep filebeat
172.30.21.232/gcr.io/filebeat-alpine-v7.3.0                      v1.1                 76b050f62ce4        About an hour ago   134MB
大小为134M,比官网提供镜像小了快200M。(官网是根据centos构建)
5.验证nginx日志通过filebeat将日志输出到kafka
[root@cc-k8s01 filebeat]# cat filebeat-nginx.yaml
apiVersion: v1
kind: Namespace
metadata:
  name: default
  labels:
    name: filebeat
---
apiVersion: extensions/v1beta1
kind: Deployment
metadata:
  name: nginx-test
spec:
  replicas: 3
  template:
    metadata:
      labels:
        k8s-app: nginx-test
    spec:
      containers:
      - image: nginx
        imagePullPolicy: Always
        name: nginx-test
        ports:
        - containerPort: 80
        volumeMounts:
        - name: nginx-logs
          mountPath: /var/log/nginx
      - image: 172.30.21.232/gcr.io/filebeat-alpine-v7.3.0:v1.1
        imagePullPolicy: Always
        name: filebeat
        volumeMounts:
        - name: nginx-logs
          mountPath: /log
        - name: filebeat-config
          mountPath: /etc/filebeat/
      volumes:
      - name: nginx-logs
        emptyDir: {}
      - name: filebeat-config
        configMap:
          name: filebeat-config
---
apiVersion: v1
kind: ConfigMap
metadata:
  name: filebeat-config
data:
  filebeat.yml: |-
    filebeat.inputs:
    - type: log
      paths:
        - /log/*
    #setup.template.name: "logstash-nginx"      #默认的index为filebeat-7.3-YYYY.MM.dd,需设置这两个参数,自定义索引名
    #setup.template.pattern: "logstash-nginx-*"
    #output.elasticsearch:
    #  hosts: ["172.30.21.232:9200"]
    #  index: "logstash-nginx-%{+yyyy.MM.dd}"
    output.kafka:
      enabled: true
      hosts: ["172.30.0.192:9092","172.30.0.193:9092","172.30.0.194:9092"]
      topic: "nginx"
      partition.round_robin:         #开启kafka的partition分区
        reachable_only: true
      compression: gzip      #压缩格式
      max_message_bytes: 10000000    #压缩格式字节大小
---
apiVersion: v1
kind: Service
metadata:
  name: nginx-test
  labels:
    k8s-app: nginx-test
spec:
  type: NodePort
  ports:
  - port: 80
    protocol: TCP
    targetPort: 80
    name: http
    nodePort: 32765
  selector:
    k8s-app: nginx-test
6.通过kubectl apply -f应用,查看
[root@cc-k8s01 filebeat]# kubectl get pods
NAME                              READY   STATUS      RESTARTS   AGE
counter                           1/1     Running     0          29d
dnsutils-ds-5k68w                 1/1     Running     1161       51d
dnsutils-ds-f67hp                 1/1     Running     347        14d
dnsutils-ds-z5kfn                 0/1     Completed   1160       51d
helmredis-redis-ha-server-0       2/2     Running     0          22h
helmredis-redis-ha-server-1       2/2     Running     0          22h
helmredis-redis-ha-server-2       2/2     Running     0          22h
my-nginx-5dd67b97fb-gv575         1/1     Running     0          23d
my-nginx-5dd67b97fb-s8k4p         1/1     Running     0          23d
nfs-provisioner-8cd7897c9-cq8fv   1/1     Running     0          28d
nginx-test-69c75db9cc-76q69       2/2     Running     0          58m
nginx-test-69c75db9cc-lbft8       2/2     Running     0          58m
nginx-test-69c75db9cc-rq5td       2/2     Running     0          58m
test-nginx-6dcd7c6dc5-88qzl       1/1     Running     0          23d
test-nginx-6dcd7c6dc5-cshsj       1/1     Running     0          23d
test-nginx-6dcd7c6dc5-v4wxv       1/1     Running     0          23d
查看nginx-test已经在Running状态,因为是通过NodePort模式,访问NodePort端口,然后查看topic
[root@cc-k8s01 filebeat]# /opt/appl/kafka_2.11-2.1.1/bin/kafka-console-consumer.sh --bootstrap-server 172.30.0.193:9092 172.30.0.194:9092 --topic nginx
7.使用fluentd作为logging-agent
[root@cc-k8s01 filebeat]# cat fluentd-nginx.yaml
apiVersion: v1
kind: Namespace
metadata:
  name: fluentd
  labels:
    name: fluentd
---
apiVersion: extensions/v1beta1
kind: Deployment
metadata:
  namespace: fluentd
  name: fluentd-nginx
spec:
  replicas: 3
  template:
    metadata:
      labels:
        k8s-app: fluentd-nginx
    spec:
      containers:
      - image: nginx
        imagePullPolicy: Always
        name: fluentd-nginx
        ports:
        - containerPort: 80
        volumeMounts:
        - name: nginx-logs
          mountPath: /var/log/nginx
      - image: harbor-dev.iboxpay.com/gcr.io/fluentd:v2.4.3
        imagePullPolicy: Always
        name: fluentd
        volumeMounts:
        - name: nginx-logs
          mountPath: /log
        - name: fluentd-config
          mountPath: /etc/fluent
      volumes:
      - name: nginx-logs
        emptyDir: {}
      - name: fluentd-config
        configMap:
          name: fluentd-config
---
apiVersion: v1
kind: ConfigMap
metadata:
  namespace: fluentd
  name: fluentd-config
data:
  fluent.conf: |-
    <source>
      type tail
      format none
      path /log/*.log
      pos_file /log/log.pos
      tag fluentd-nginx_log
    </source>

    <match fluentd-nginx_log**>
      @type kafka_buffered
      brokers 172.30.0.192:9092,172.30.0.193:9092,172.30.0.194:9092
      default_topic fluentd-nginx_log
      output_data_type json
      buffer_type file
      buffer_path /log/fluentd-nginx.buffer
    </match>
---
apiVersion: v1
kind: Service
metadata:
  namespace: fluentd
  name: fluentd-nginx
  labels:
    k8s-app: fluentd-nginx
spec:
  type: NodePort
  ports:
  - port: 80
    protocol: TCP
    targetPort: 80
    name: http
    nodePort: 32764
  selector:
    k8s-app: fluentd-nginx
配置logstash用来消费kafka数据
[root@docker1 conf.d]# cat out.conf
input {
       kafka {
         bootstrap_servers =>  "172.30.0.192:9092,172.30.0.193:9092,172.30.0.194:9092"
         topics => ["nginx"]
         codec => "json"
       }
}
output {
       elasticsearch {
         hosts => ["http://172.30.21.232:9200" ]
         index => "logstash-nginx-kafka-%{+YYYY.MM.dd}"
         template_overwrite => true
         #user => "elastic"
         #password => "xRI&h2AZaJ"
         #document_type => "%{[type]}"
       }

       #stdout { codec => rubydebug }
}
curl http://node/32765
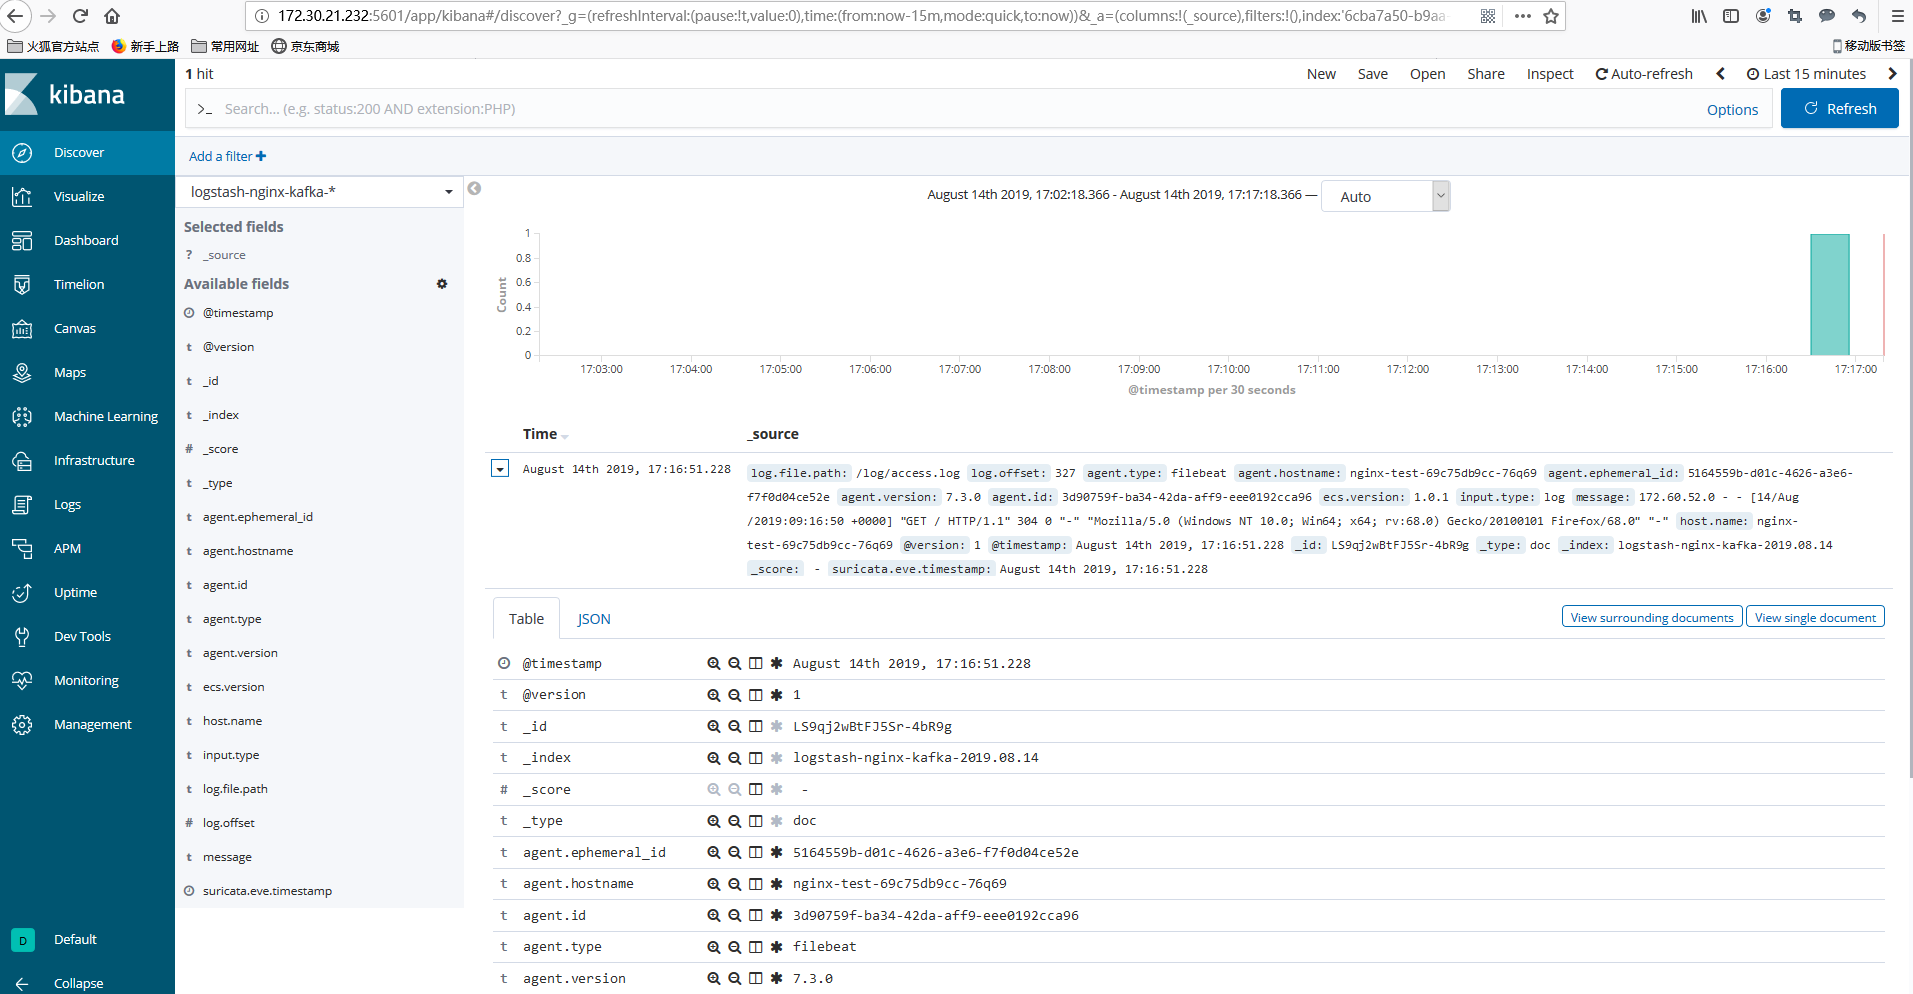
查看kibana


 946
946

 被折叠的 条评论
为什么被折叠?
被折叠的 条评论
为什么被折叠?
 到【灌水乐园】发言


