


1、下载XHProf
2、安装XHProf
把压缩包里的 xhprof_0.10.3_php53_vc9.dll 拷贝到PHP的ext目录下,然后在php.ini配置里面加入配置(不要忘记创建对应的文件夹)
[xhprof]
extension=xhprof_0.10.3_php53_vc9.dll
; directory used by default implementation of the iXHProfRuns
; interface (namely, the XHProfRuns_Default class) for storing
; XHProf runs.
xhprof.output_dir="d:/PHP/xhprof/log"
重启Apache,看看phpinfo()里面有没有xhprof相关信息!
3、使用XHProf
将 xhprof_html.zip 解压到你想测试的网站根目录,如我放在了网站目录的 /public/xhprof/windows 下。
测试文件:
function bar($x) {
if ($x > 0) {
bar($x - 1);
}
}
function foo() {
for ($idx = 0; $idx < 5; $idx++) {
bar($idx);
$x = strlen("abc");
}
}
// 启动xhprof
xhprof_enable(XHPROF_FLAGS_CPU + XHPROF_FLAGS_MEMORY);
// 调用foo函数,也是我们要分析的函数
foo();
// 停止xhprof
$xhprof_data = xhprof_disable();
// 取得统计数据
//print_r($xhprof_data);
$os = 'windows';
$XHPROF_ROOT = dirname(__FILE__) . '/public/xhprof/' . $os;
include_once $XHPROF_ROOT . "/xhprof_lib/utils/xhprof_lib.php";
include_once $XHPROF_ROOT . "/xhprof_lib/utils/xhprof_runs.php";
// 保存统计数据,生成统计ID和source名称
$xhprof_runs = new XHProfRuns_Default();
$run_id = $xhprof_runs->save_run($xhprof_data, "xhprof_foo"); // source名称是xhprof_foo
// 查看统计信息
echo "
";当点击链接“[View Full Callgraph]”时,会报错:
failed to execute cmd: " dot -Tpng"
所以还需要下载图形工具 Graphviz。
4、下载Graphviz
5、安装Graphviz
解压后,把Graphviz拷贝到某个目录,如 d:/PHP/xhprof/graphviz-2.38/
6、配置Graphviz
找到上述提到网站目录 /public/xhprof/windows/ 下的 config.php 文件,调整如下:
/**
* Set the absolute paths on your system
*/
define('ERROR_FILE', 'd:/PHP/xhprof/log/xhprof_dot_errfile.log');
define('TMP_DIRECTORY', 'd:/PHP/xhprof/tmp');
define('DOT_BINARY', 'd:/PHP/xhprof/graphviz-2.38/release/bin/dot.exe');
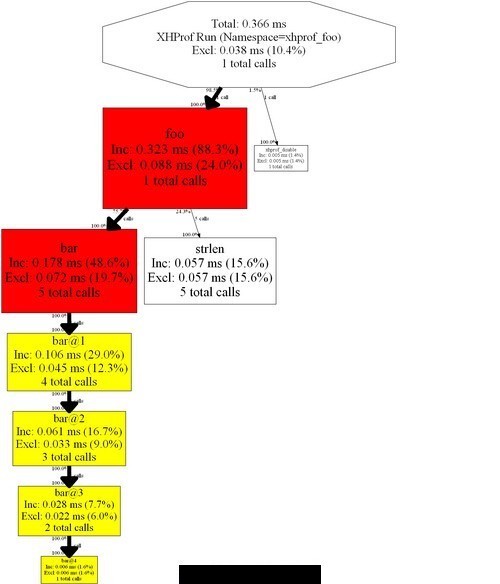
重新点击链接 [View Full Callgraph],一张期待已久的效果图出来啦:
延伸阅读:


 172
172


 被折叠的 条评论
为什么被折叠?
被折叠的 条评论
为什么被折叠?
 到【灌水乐园】发言


