


1.验证数据是否服从正态分布?
import pandas as pd
import numpy as np
path = 'E:\\english\\data.xlsx'
data=pd.read_excel(path)
######按照港口分类,计算数据的统计量
embark = data.groupby(['Embarked'])
embark_basic=data.groupby(['Embarked']).agg(['count','min','max','median','mean','var','std'])
age_basic=embark_basic['Age']
fare_basic=embark_basic['Fare']
age_basic
count min max median mean var std
Embarked
C 130 0.42 71.0 29.0 30.814769 238.234892 15.434860
Q 28 2.00 70.5 27.0 28.089286 286.130622 16.915396
S 554 0.67 80.0 28.0 29.445397 200.029876 14.143192
fare_basic
countminmaxmedianmeanvarstd
Embarked
C1304.0125512.329236.252168.2967678200.71915390.557822
Q286.750090.00007.750018.265775477.14206421.843582
S5540.0000263.000013.000027.4762841335.63654336.546362
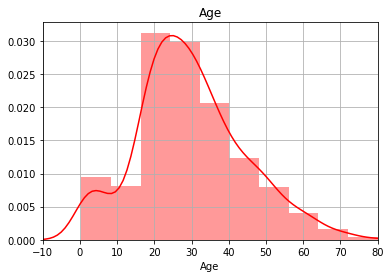
######验证年龄是否服从正态分布
import seaborn as sns
sns.set_palette("hls")
sns.distplot(data['Age'],color='r',bins=10,kde=True)
plt.title('Age')
plt.xlim(-10,80)
plt.grid(True)
plt.show()
######验证是否服从正态分布
from scipy import stats
ks_test = stats.kstest(data['Age'], 'norm')
shapiro_test=stats.shapiro(data['Age'])
normaltest_test=stats.normaltest(data['Age'],axis=0)
print('ks_test:',ks_test)
print('shapiro_test:',shapiro_test)
print('normaltest_test:',normaltest_test)
ks_test: KstestResult(statistic=0.9649422367998306, pvalue=0.0)
shapiro_test: (0.9815102219581604, 7.906476895414016e-08)
normaltest_test: NormaltestResult(statistic=18.12938011101228, pvalue=0.00011567916063448067)
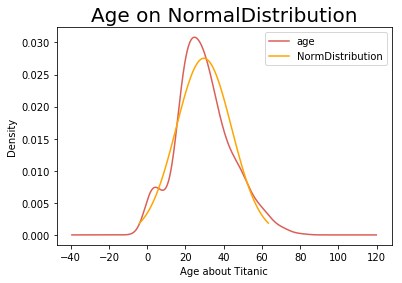
由于p<0.05,拒绝原假设,认为数据不服从正态分布
绘制拟合正态分布曲线
age = data['Age']
plt.figure()
age.plot(kind = 'kde') ###### 原始数据的正态分布
M_S=stats.norm.fit(age) ######正态分布拟合的平均值loc,标准差 scale
normalDistribution = stats.norm(M_S[0], M_S[1]) ###### 绘制拟合的正态分布图
x = np.linspace(normalDistribution.ppf(0.01), normalDistribution.ppf(0.99), 100)
plt.plot(x, normalDistribution.pdf(x), c='orange')
plt.xlabel('Age about Titanic')
plt.title('Age on NormalDistribution', size=20)
plt.legend(['age', 'NormDistribution'])
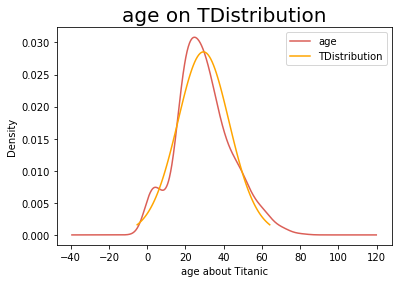
2验证是否服从T分布
np.random.seed(1)
ks = stats.t.fit(age)
df = ks[0]
loc = ks[1]
scale = ks[2]
ks2 = stats.t.rvs(df=df,loc=loc,scale=scale,size=len(age))
stats.ks_2samp(age,ks2)
p<0.05,拒绝原假设,认为数据不服从T分布
绘制拟合的T分布图
plt.figure()
age.plot(kind = 'kde')
TDistribution = stats.t(ks[0],ks[1],ks[2])
x = np.linspace(TDistribution.ppf(0.01), TDistribution.ppf(0.99), 100)
plt.plot(x, TDistribution.pdf(x),c='orange')
plt.xlabel('age about Titanic')
plt.title('age on TDistribution',size=20)
plt.legend(['age','TDistribution'])
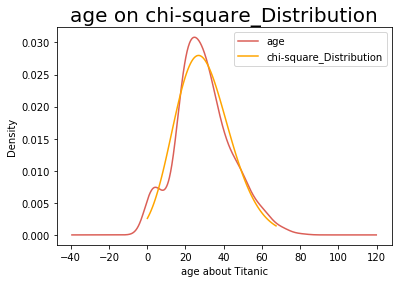
3.验证数据是否服从卡方分布
chi_S = stats.chi2.fit(age)
df_chi = chi_S[0]
loc_chi = chi_S[1]
scale_chi = chi_S[2]
chi2 = stats.chi2.rvs(df=df_chi,loc=loc_chi,scale=scale_chi,size=len(age))
stats.ks_2samp(age,chi2)
Ks_2sampResult(statistic=0.05898876404494382, pvalue=0.1678541416784373)
对数据进行卡方拟合
plt.figure()
age.plot(kind='kde')
chiDistribution=stats.chi2(chi_S[0],chi_S[1],chi_S[2]) # 绘制拟合的正态分布图
x=np.linspace(chiDistribution.ppf(0.01),chiDistribution.ppf(0.99),100)
plt.plot(x,chiDistribution.pdf(x),c='orange')
plt.xlabel('age about Titanic')
plt.title('age on chi-square_Distribution', size=20)
plt.legend(['age','chi-square_Distribution'])


 301
301


 被折叠的 条评论
为什么被折叠?
被折叠的 条评论
为什么被折叠?
 到【灌水乐园】发言


