


Study cohorts and DNA methylation array normalization
To identify AD-associated DNAm variation, we utilized a discovery and replication cohort of AD patients and healthy controls, who were closely matched for age, sex and smoking behaviour. Demographic and AD-relevant characteristics as well as AUDIT and GSI scores of both cohorts are provided in Table 1a and b. To measure the effectiveness of the 3-week alcohol treatment program, we compared both GSI and OCDS scores in the discovery cohort at the beginning and after treatment. We found that both values decreased significantly, indicating a reduced alcohol craving and a better overall psychological well-being post-treatment (Table 1c).
Table 1 Description of a) the discovery study cohort, b) the replication study cohort and c) results after 3-week alcohol treatment program in the discovery cohort.
In order to assess the association of AD with genome-wide DNAm in our discovery cohort, we measured site-specific DNAm at over 450,000 CpGs using the Illumina 450 K array. To test for potential cellular heterogeneity in the bead-purified CD3+ T-cell samples, we used the Houseman blood deconvolution algorithm to estimate cell-type proportions, observing up to 32% of contaminating non-T-cell DNA in a fraction of our samples, although these proportions were not correlated with group status (Supplementary Figure S1). Regression-based adjustment of 450 K data resulted in the removal of these cell type associations as assessed by PCA (Supplementary Figure S2). The adjusted dataset thereby represented DNAm profiles from T-cells whose inter-individual cell type differences had been normalized to the best of our abilities for subsequent analyses.
Identification of AD-associated differential DNAm
Based on site-specific analyses of the T-cell DNAm array profiles, we identified 59 differentially methylated CpG sites between patients (T1) and controls with DNAm differences (Δ-beta) of at least 5% to increase the likelihood of biological relevance (FDR
Figure 1
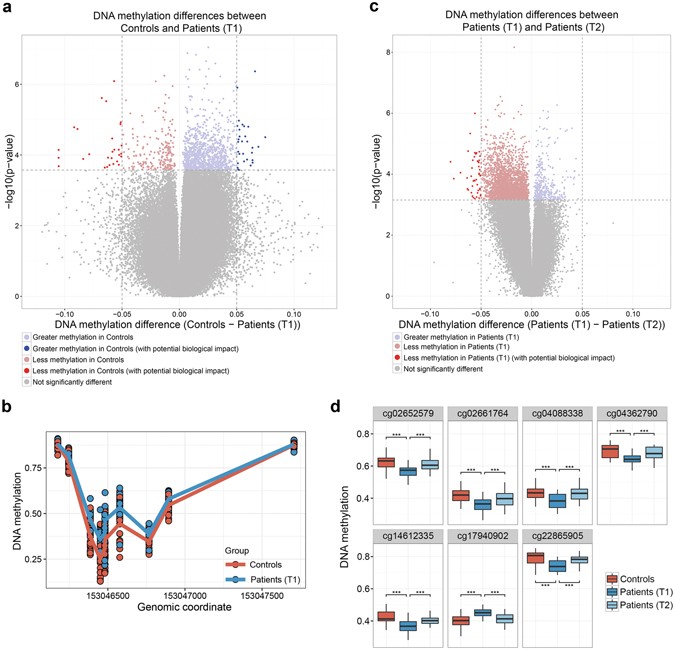
Differential sites and regions identified in the 450 K array analyses. (a) Volcano plot depicting differences in DNAm levels between controls and patient (T1) for each probe in the corrected 450 K dataset (indicated on X axis) against FDR (indicated on Y axis, on –log10 scale). Dashed horizontal line denotes FDR threshold of 0.1 while dashed vertical lines denote DNAm difference thresholds of −0.05 and 0.05, respectively. (b) Differential DNAm detected by DMRcate in the promoter region of the SRPK3 gene (chrX:153, 046, 386–153, 046, 482). (c) Volcano plot depicting differences in DNAm levels between patients (T1) and patients (T2) as described in panel (a). (d) DNAm levels of seven sites which show reversion of DNAm post-treatment. ***Indicate an FDR
Table 2 Top 10 differentially methylated sites a) between controls and patients (T1) and b) between patients (T1) and patients (T2).
In addition to single CpG sites, we identified 29 significant DMRs (FDR 5%) using DMRCate. These DMRs contained 153 CpG sites, of which 8 were also identified as differentially methylated in the site-specific analysis between controls and patients (T1) (Supplementary Table S2). Interestingly, 4 of these overlapping 8 hits were in the SRPK3 gene region (Fig. 1b).
Treatment-related alterations in T-cell DNAm profiles
To identify differentially methylated sites potentially playing an important role in alcohol withdrawal and early recovery in AD patients, we compared genome-wide T-cell DNAm profiles of patients before (T1) and after 3 weeks (T2) of participation in an alcohol treatment program. Using paired testing in our site-specific analyses, we identified 48 differentially methylated sites between patients (T1) and patients (T2), all of which showed increased methylation at T2 ranging from 5 to 12% difference (FDR 5%) (Fig. 1c, Supplementary Table S3). The top 10 hits are listed in Table 2b. Utilizing the same threshold as before, we did not observe any DMRs in patients before and after treatment.
Post-treatment reversion of differentially methylated sites
To examine whether AD-associated DNAm is influenced by a 3-week alcohol treatment program, we assessed DNAm levels in patients post-treatment at the 59 sites identified in the analysis comparing controls and patients (T1). After the treatment (T2), the DNAm levels of 7 out of 59 sites reverted back to a level where they no longer significantly differed from controls (Fig. 1d). Based on paired testing, we determined that these 7 sites were indeed differentially methylated between patients (T1) and patients (T2). Moreover, 32 CpG sites showed a trend to revert back, though not significant at an FDR
Assessment of mean global DNAm differences between groups
Given the unidirectional change in our site-specific analysis of patients before and after treatment, particularly at AD-associated sites which showed post-treatment reversion, we next examined if this trend was related to AD-associated differences in mean global DNAm. Here we defined mean global DNAm as the calculated average of DNAm values across all sites in each sample. We found that although the result was only nominally statistically significant, prior to the alcohol treatment (T1), mean global DNAm was lower in patients compared to controls (P = 0.048, Mann-Whitney U test). However, at the end of treatment (T2), global DNAm of the patients approximated the levels seen in controls and no longer differed significantly from controls (Fig. 2a). This finding was consistent with the unidirectional differences, in that all significant sites between patients before and after treatment showed increased methylation at T2 in the site-specific analysis, and supported the observed post-treatment reversion of AD-associated sites. Of note, these differences in mean global DNAm are unlikely to be driven by batch effects or other sources of technical variation due to the fact that all samples were run in a randomized manner on the same set of arrays.
Figure 2

Mean global DNAm differences and naïve T-cell subtype differences between groups. (a) Patients (T1) showed significantly decreased mean global DNAm levels compared to controls (P = 0.048, Mann-Whitney U test). Differences between controls vs. patients (T2) and patients (T1) vs. patients (T2) were not significant. (b) Abundance levels of naïve CD8+ and CD4+ T-cells were predicted using an advanced blood DNA methylation age prediction tool. Both naïve T-cell subtypes significantly increased post-treatment in patients (**Indicates an FDR
Differences in naïve T-cell subtype abundances between groups
To evaluate if there were differences in underlying T-cell subtypes between the groups, we estimated abundance measures of additional blood cell subsets using an advanced blood analysis option for an epigenetic clock prediction tool+ and CD8+ naïve T-cell subsets significantly increased post-treatment in AD patients (FDR
Validation of AD-associated differential DNA methylation by pyrosequencing
To verify the results from the 450 K dataset, we selected two top-ranking differentially methylated sites between controls and patients (T1) (cg18752527 in the HECW2 gene and cg07280807 in an intergenic region) for validation using pyrosequencing as an independent readout of DNAm measures. We additionally validated two promoter CpGs of SRPK3 (cg16529483 and cg24496423) since differential methylation in the SRPK3 gene region was found to be a robust finding in our DMRcate analyses. We were able to confirm significant differences between controls and patients (T1) at all 4 sites, as shown in Fig. 3a (Student’s t-test, FDR 0.7, FDR
Figure 3
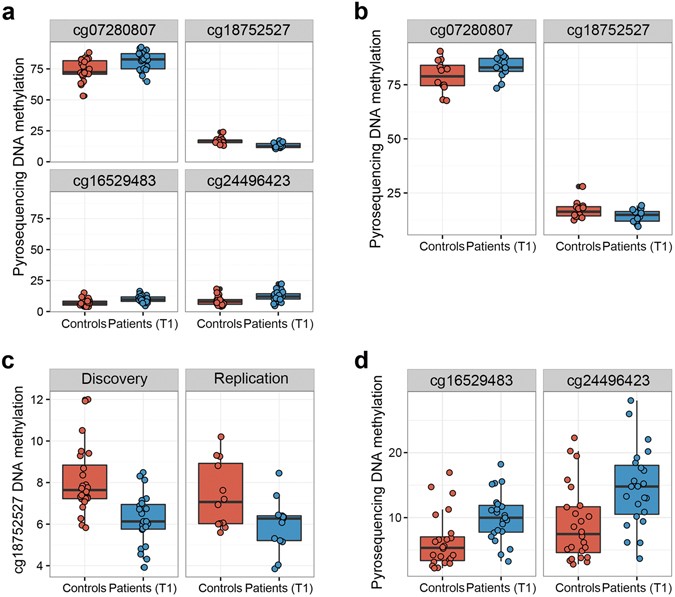
Validation and replication of top-ranking hits by pyrosequencing. (a) Boxplots showing differences in DNAm levels of discovery cohort T-cell samples as measured by pyrosequencing (FDR
Replication of AD-associated differential DNA methylation in an independent cohort
To further test the robustness of our EWAS findings, we analysed the previously mentioned 4 sites in T-cells of an independent replication cohort by pyrosequencing. The two top-ranking hits, cg07280807 in an intergenic region and cg18752527 in HECW2, were differentially methylated in the replication cohort (FDR
Analysis of differential DNA methylation in whole blood
To identify sites that are not only differentially methylated in T-cells, but also in whole blood DNA, we sought to reproduce our most robust EWAS findings from T-cells in whole blood DNA samples of both our discovery and replication cohorts. Therefore, we analysed DNAm of the 4 previously mentioned sites in whole blood samples by pyrosequencing. We observed differential methylation of cg18752527 in the intragenic region of HECW2 between controls and patients (T1) in both cohorts (FDR


 316
316


 被折叠的 条评论
为什么被折叠?
被折叠的 条评论
为什么被折叠?
 到【灌水乐园】发言


