Simple Plot,单个图表
#Simple Plot
import matplotlib.pyplot as plt
import numpy as np
#Data for plotting
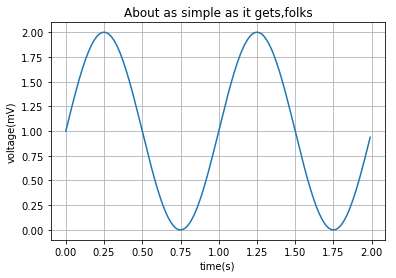
t=np.arange(0.0,2.0,0.01)
s=1+np.sin(2*np.pi*t)
# Note that using plt.subplots below is equivalent to using
# fig = plt.figure and then ax = fig.add_subplot(111)
fig,ax=plt.subplots()
ax.plot(t,s) #创建图表
#设置图表格式
ax.set(xlabel='time(s)',ylabel='voltage(mV)',
title='About as simple as it gets,folks')
ax.grid() #显示网格线
plt.show() #显示图片
Multiple Subplots in one figure,多个图表
#Multiple Subplots
import matplotlib.pyplot as plt
import numpy as np

#Data for plot
#np.linspace default number=50
x1=np.linspace(0.0,5.0)
x2=np.linspace(0.0,2.0)
y1=np.cos(2*np.pi*x1)
y2=np.cos(2*np.pi*x2)

#创建第1张图
plt.subplot(2,1,1)
plt.plot(x1,y1,'o-')
plt.title('A tale of 2 subplots')      #标题栏
plt.ylabel('Damped oscillation')       #y轴标签

#创建第2张图
plt.subplot(2,1,2)
plt.plot(x2,y2,'.-')
plt.xlabel('time(s)')                 #x轴标签
plt.ylabel('Undamped')                #y轴标签

plt.show()                            #显示图片


 被折叠的 条评论
为什么被折叠?
被折叠的 条评论
为什么被折叠?
 到【灌水乐园】发言


