


原文内容你可能需要翻墙才能看见!(译文在最下面)
https://engineering.instagram.com/web-service-efficiency-at-instagram-with-python-4976d078e366
Instagram currently features the world’s largest deployment of the Django web framework, which is written entirely in Python.We initially chose to use Python because of its reputation for simplicity and practicality, which aligns well with our philosophy of “do the simple thing first.” But simplicity can come with a tradeoff: efficiency. Instagram has doubled in size over the last two years and recently crossed 500 million users, so there is a strong need to maximize web service efficiency so that our platform can continue to scale smoothly. In the past year we’ve made our efficiency program a priority, and over the last six months we’ve been able to maintain our user growth without adding new capacity to our Django tiers. In this post, we’ll share some of the tools we built and how we use them to optimize our daily deployment flow.
Why Efficiency?
Instagram, like all software, is limited by physical constraints like servers and datacenter power. With these constraints in mind, there are two main goals we want to achieve with our efficiency program:
Instagram should be able to serve traffic normally with continuous code rollouts in the case of lost capacity in one data center region, due to natural disaster, regional network issues, etc.
Instagram should be able to freely roll out new products and features without being blocked by capacity.
To meet these goals, we realized we needed to persistently monitor our system and battle regression.
Defining Efficiency
Web services are usually bottlenecked by available CPU time on each server. Efficiency in this context means using the same amount of CPU resources to do more work, a.k.a, processing more user requests per second (RPS). As we look for ways to optimize, our first challenge is trying to quantify our current efficiency. Up to this point, we were approximating efficiency using ‘Average CPU time per requests,’ but there were two inherent limitations to using this metric:
Diversity of devices.Using CPU time for measuring CPU resources is not ideal because it is affected by both CPU models and CPU loads.
Request impacts data.Measuring CPU resource per request is not ideal because adding and removing light or heavy requests would also impact the efficiency metric using the per-requests measurement.
Compared to CPU time, CPU instruction is a better metric, as it reports the same numbers regardless of CPU models and CPU loads for the same request. Instead of linking all our data to each user request, we chose to use a ‘per active user’ metric. We eventually landed on measuring efficiency by using ‘CPU instruction per active user during peak minute.’ With our new metric established, our next step was to learn more about our regressions by profiling Django.
Profiling the Django Service
There are two major questions we want to answer by profiling our Django web service:
Does a CPU regression happen?
What causes the CPU regression and how do we fix it?
To answer the first question, we need to track the CPU-instruction-per-active-user metric. If this metric increases, we know a CPU regression has occurred.
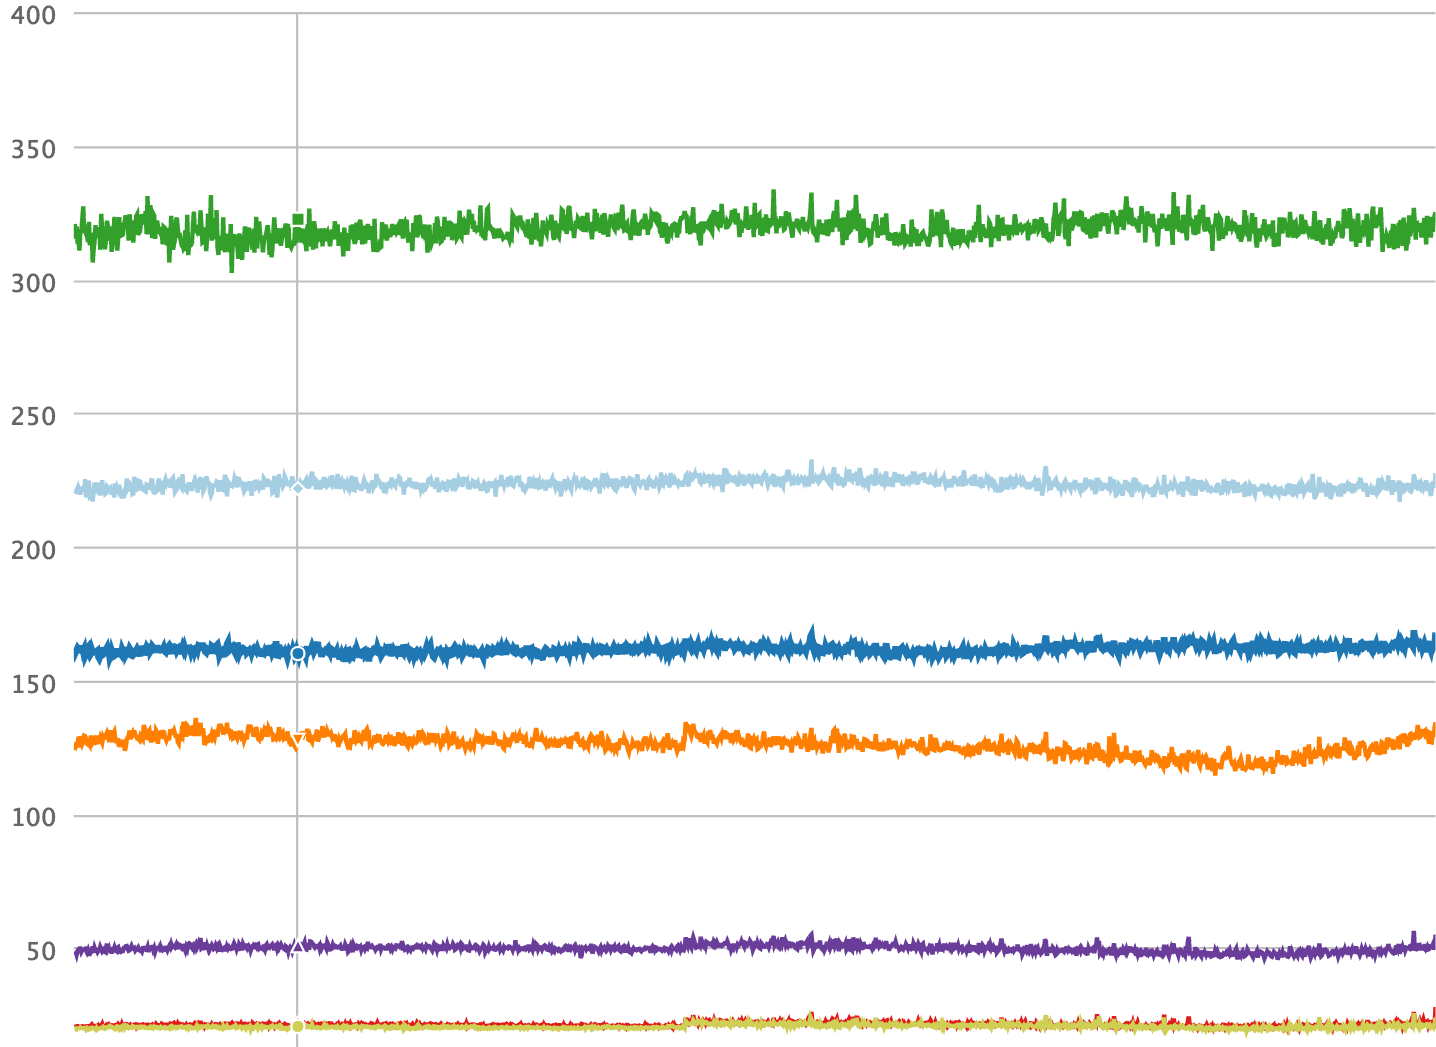
The tool we built for this purpose is called Dynostats. Dynostats utilizes Django middleware to sample user requests by a certain rate, recording key efficiency and performance metrics such as the total CPU instructions, end to end requests latency, time spent on accessing memcache and database services, etc. On the other hand, each request has multiple metadata that we can use for aggregation, such as the endpoint name, the HTTP return code of the request, the server name that serves this request, and the latest commit hash on the request. Having two aspects for a single request record is especially powerful because we can slice and dice on various dimensions that help us narrow down the cause of any CPU regression. For example, we can aggregate all requests by their endpoint names as shown in the time series chart below, where it is very obvious to spot if any regression happens on a specific endpoint.
CPU instructions matter for measuring efficiency — and they’re also the hardest to get. Python does not have common libraries that support direct access to the CPU hardware counters (CPU hardware counters are the CPU registers that can be programmed to measure performance metrics, such as CPU instructions). Linux kernel, on the other hand, provides theperf_event_opensystem call. Bridging through Pythonctypesenables us to call thesyscallfunction in standard C library, which also provides C compatible data types for programming the hardware counters and reading data from them.
With Dynostats, we can already find CPU regressions and dig into the cause of the CPU regression, such as which endpoint gets impacted most, who committed the changes that actually cause the CPU regression, etc. However, when a developer is notified that their changes have caused a CPU regression, they usually have a hard time finding the problem. If it was obvious, the regression probably wouldn’t have been committed in the first place!
That’s why we needed a Python profiler that the developer can use to find the root cause of the regression (once Dynostats identifies it). Instead of starting from scratch, we decided to make slight alterations to cProfile, a readily available Python profiler. The cProfile module normally provides a set of statistics describing how long and how often various parts of a program were executed. Instead of measuring in time, we took cProfile and replaced the timer with a CPU instruction counter that reads from hardware counters. The data is created at the end of the sampled requests and sent to some data pipelines. We also send metadata similar to what we have in Dynostats, such as server name, cluster, region, endpoint name, etc.
On the other side of the data pipeline, we created a tailer to consume the data. The main functionality of the tailer is to parse the cProfile stats data and create entities that represent Python function-level CPU instructions. By doing so, we can aggregate CPU instructions by Python functions, making it easier to tell which functions contribute to CPU regression.
Monitoring and Alerting Mechanism
At Instagram, wedeploy our backend 30–50 times a day. Any one of these deployments can contain troublesome CPU regressions. Since each rollout usually includes at least one diff, it is easy to identify the cause of any regression. Our efficiency monitoring mechanism includes scanning the CPU instruction in Dynostats before and after each rollout, and sending out alerts when the change exceeds a certain threshold. For the CPU regressions happening over longer periods of time, we also have a detector to scan daily and weekly changes for the most heavily loaded endpoints.
Deploying new changes is not the only thing that can trigger a CPU regression. In many cases, the new features or new code paths are controlled by global environment variables (GEV). There are very common practices for rolling out new features to a subset of users on a planned schedule. We added this information as extra metadata fields for each request in Dynostats and cProfile stats data. Grouping requests by those fields reveal possible CPU regressions caused by turning the GEVs. This enables us to catch CPU regressions before they can impact performance.
What’s Next?
Dynostats and our customized cProfile, along with the monitoring and alerting mechanism we’ve built to support them, can effectively identify the culprit for most CPU regressions. These developments have helped us recover more than 50% of unnecessary CPU regressions, which would have otherwise gone unnoticed.
There are still areas where we can improve and make it easier to embed into Instagram’s daily deployment flow:
The CPU instruction metric is supposed to be more stable than other metrics like CPU time, but we still observe variances that make our alerting noisy. Keeping signal:noise ratio reasonably low is important so that developers can focus on the real regressions. This could be improved by introducing the concept of confidence intervals and only alarm when it is high. For different endpoints, the threshold of variation could also be set differently.
One limitation for detecting CPU regressions by GEV change is that we have to manually enable the logging of those comparisons in Dynostats. As the number of GEVs increases and more features are developed, this wont scale well. Instead, we could leverage an automatic framework that schedules the logging of these comparisons and iterates through all GEVs, and send alerts when regressions are detected.
cProfile needs some enhancement to handle wrapper functions and their children functions better.
With the work we’ve put into building the efficiency framework for Instagram’s web service, we are confident that we will keep scaling our service infrastructure using Python. We’ve also started to invest more into the Python language itself, and are beginning to explore moving our Python from version 2 to 3. We will continue to explore this and more experiments to keep improving both infrastructure and developer efficiency, and look forward to sharing more soon.
Min Ni is a software engineer at Instagram.
--------------------------------------------------------------------------------------------------------------------
Instagram目前拥有世界上最大的Django Web框架部署,该框架完全用Python编写。我们最初选择使用Python是因为它在简单性和实用性方面的声誉,这与我们的“先做简单的事情”的理念很吻合。但简单性可以带来权衡:效率。Instagram在过去两年中的规模翻了一番,最近超过了5亿用户,因此强烈需要最大限度地提高Web服务效率,以便我们的平台能够继续顺利扩展。在过去的一年里,我们将效率计划作为优先事项,在过去六个月中,我们能够在不增加Django层级新容量的情况下保持用户增长。在这篇文章中,我们将分享我们构建的一些工具以及我们如何使用它们来优化我们的日常部署流程。
效率为何?
与所有软件一样,Instagram受到服务器和数据中心等物理限制的限制。考虑到这些限制因素,我们希望通过效率计划实现两个主要目标:
由于自然灾害,区域网络问题等原因,在一个数据中心区域内容量损失的情况下,Instagram应该能够通过连续的代码部署正常提供流量。
Instagram应该能够自由推出新产品和功能,而不会被容量阻挡。
为了实现这些目标,我们意识到我们需要持续监控我们的系统并对抗回归。
定义效率
Web服务通常会受到每台服务器上可用CPU时间的限制。此上下文中的效率意味着使用相同数量的CPU资源来执行更多工作,即每秒处理更多用户请求(RPS)。在我们寻找优化方法时,我们的第一个挑战是尝试量化我们当前的效率。到目前为止,我们使用“每个请求的平均CPU时间”来近似效率,但使用此度量标准有两个固有的限制:
设备的多样性。使用CPU时间测量CPU资源并不理想,因为它受CPU模型和CPU负载的影响。
请求影响数据。测量每个请求的CPU资源并不理想,因为添加和删除轻量级或重量级请求也会影响使用每个请求测量的效率度量。
与CPU时间相比,CPU指令是一个更好的度量标准,因为它报告相同的数字,而不管相同请求的CPU模型和CPU负载。我们选择使用“每个活跃用户”指标,而不是将所有数据都链接到每个用户请求。我们最终通过在高峰时段使用“每个活动用户的CPU指令”来测量效率。建立新的度量标准后,我们的下一步是通过分析Django来了解有关我们的回归的更多信息。
分析Django服务
我们想要通过分析我们的Django Web服务来回答两个主要问题:
CPU回归发生了吗?
导致CPU回归的原因是什么?我们如何解决?
要回答第一个问题,我们需要跟踪CPU-instruction-per-active-user指标。如果此指标增加,我们就知道发生了CPU回归。
我们为此目的而构建的工具称为Dynostats。Dynostats利用Django中间件以一定的速率对用户请求进行采样,记录关键效率和性能指标,例如总CPU指令,端到端请求延迟,访问内存缓存和数据库服务所花费的时间等。另一方面,每个请求我们可以使用多个元数据进行聚合,例如端点名称,请求的HTTP返回代码,提供此请求的服务器名称以及请求中的最新提交哈希。单个请求记录的两个方面特别强大,因为我们可以在各种维度上切片和切块,这有助于我们缩小任何CPU回归的原因。例如,我们可以按端点名称聚合所有请求,如下面的时间序列图所示,
CPU指令对于测量效率很重要 - 而且它们也是最难获得的。Python没有支持直接访问CPU硬件计数器的公共库(CPU硬件计数器是可以编程以测量性能指标的CPU寄存器,例如CPU指令)。另一方面,Linux内核提供perf_event_open系统调用。通过Python ctypes进行桥接使我们能够在标准C库中调用syscall函数,该库还提供C兼容的数据类型,用于编程硬件计数器和从中读取数据。
使用Dynostats,我们已经可以找到CPU回归并深入了解CPU回归的原因,例如哪个端点受到最大影响,谁提交了实际导致CPU回归的更改等等。但是,当开发人员收到通知他们的更改时导致CPU回归,他们通常很难找到问题。如果很明显,那么回归可能不会首先发生!
这就是为什么我们需要一个Python分析器,开发人员可以使用它来找到回归的根本原因(一旦Dynostats识别它)。我们决定对cProfile进行轻微改动,而不是从头开始,这是一个现成的Python分析器。cProfile模块通常提供一组统计信息,描述程序各个部分的执行时间和频率。我们采用cProfile而不是及时测量,并用一个从硬件计数器读取的CPU指令计数器替换了计时器。数据在采样请求结束时创建,并发送到某些数据管道。我们还发送类似于我们在Dynostats中的元数据,例如服务器名称,集群,区域,端点名称等。
在数据管道的另一端,我们创建了一个使用数据的tailer。该文件的主要功能是解析cProfile统计数据并创建表示Python功能级CPU指令的实体。通过这样做,我们可以通过Python函数聚合CPU指令,从而更容易分辨哪些函数有助于CPU回归。
监测和警报机制
在Instagram上,我们每天部署30-50次后端。这些部署中的任何一个都可能包含麻烦的CPU回归。由于每个卷展栏通常包含至少一个差异,因此很容易识别出任何回归的原因。我们的效率监控机制包括在每次推出之前和之后扫描Dynostats中的CPU指令,并在更改超过特定阈值时发出警报。对于较长时间内发生的CPU回归,我们还有一个检测器,用于扫描负载最重的端点的每日和每周更改。
部署新更改并不是唯一可以触发CPU回归的事情。在许多情况下,新功能或新代码路径由全局环境变量(GEV)控制。有一些非常常见的做法是按计划的时间表向用户子集推出新功能。我们将此信息添加为Dynostats和cProfile统计数据中每个请求的额外元数据字段。对这些字段的请求进行分组可以发现转换GEV可能导致的CPU回归。这使我们能够在它们影响性能之前捕获CPU回归。
下一步是什么?
Dynostats和我们定制的cProfile,以及我们为支持它们而构建的监控和警报机制,可以有效地识别大多数CPU回归的罪魁祸首。这些发展帮助我们恢复了超过50%的不必要的CPU回归,否则这些回归将被忽视。
仍有一些领域我们可以改进并使其更容易嵌入到Instagram的日常部署流程中:
CPU指令度量应该比CPU时间等其他指标更稳定,但我们仍然会观察到使我们的警报噪声变化的差异。保持信号:噪声比率相当低是很重要的,这样开发人员就可以专注于真正的回归。这可以通过引入置信区间的概念来改进,并且只有在它高时才会报警。对于不同的端点,也可以不同地设置变化阈值。
通过GEV变化检测CPU回归的一个限制是我们必须手动启用在Dynostats中记录这些比较。随着GEV数量的增加和更多功能的开发,这种规模不会很好。相反,我们可以利用自动框架来安排这些比较的记录并迭代所有GEV,并在检测到回归时发送警报。
cProfile需要一些增强来处理包装函数及其子函数更好。
通过我们为Instagram的Web服务构建效率框架的工作,我们相信我们将继续使用Python扩展我们的服务基础架构。我们也开始在Python语言本身投入更多资金,并开始探索将Python从第2版移到3版。我们将继续探索这个和更多实验,以不断提高基础架构和开发人员的效率,并期待分享更快。
Min Ni是Instagram的软件工程师。


 1109
1109


 被折叠的 条评论
为什么被折叠?
被折叠的 条评论
为什么被折叠?
 到【灌水乐园】发言


