


python中除了matplotlib外,PyQwt也可以用于画图。前者是基于wxpython,后者是基于PyQt,有异曲同工之妙。
下面是一个小例子:
# -*- coding: utf-8 -*-

import sys
import numpy as np
from PyQt4.QtCore import *
from PyQt4.QtGui import *
from PyQt4.Qwt5 import *

class Ex01(QWidget):
    '''
    创建QwtPlot对象,
    通过调用QwtPlot对象的方法setTitle(String)来设定图的标题文字
    setAxisTitle(AxisId, String)用来设定坐标轴的标题
    fig.xBottom和fig.yLeft为QwtPlot对象的属性,分别代表fig的下方x轴和左边的y轴
    '''
    def __init__(self):
        QWidget.__init__(self)
        fig = QwtPlot()
        fig.setParent(self)
        text = "f(x) = x + x<sup>2<\sup>"
        fig.setTitle(text)
        fig.setAxisTitle(fig.xBottom, "x")
        fig.setAxisTitle(fig.yLeft, "f(x)")
        x = np.arange(0, 10, 0.1)
        y = x +x**2
        curve = QwtPlotCurve()
        curve.setData(x, y)
        curve.attach(fig)
        fig.replot()
        fig.resize(400, 300)

def main():
    app = QApplication(sys.argv)
    frame = Ex01()
    frame.show()
    app.exec_()

if __name__ == "__main__":
    main()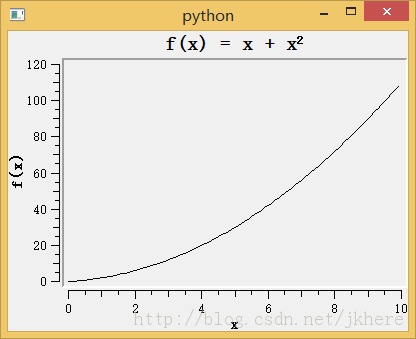


 2173
2173

 被折叠的 条评论
为什么被折叠?
被折叠的 条评论
为什么被折叠?
 到【灌水乐园】发言


