


继续昨天未完成的博客。
signalr是c#下的一种服务器与客户端通信技术。基于长轮询。(据官方文档描述,可以根据具体浏览器选择使用长轮询或者web socket)使用非常方便。
先展示结果:
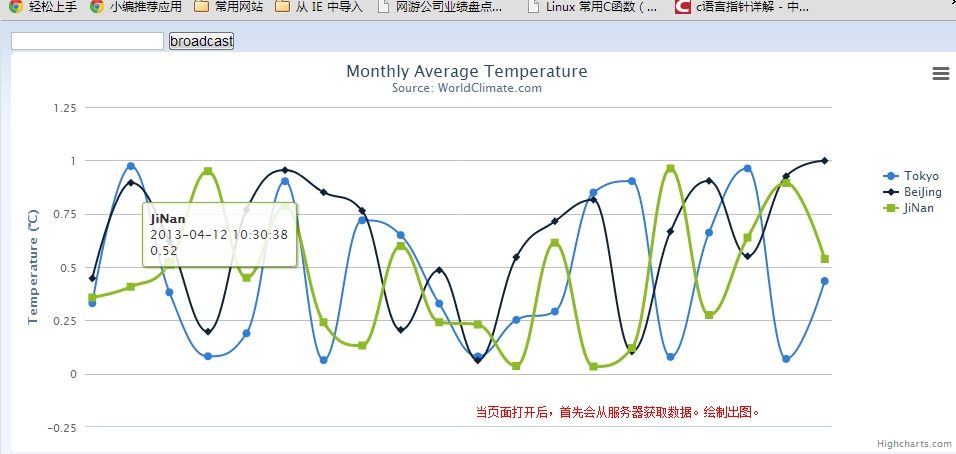
然后我用一个客户端模拟新数据插入,即向服务器发送了一个新数据。服务器会给所有的浏览器发送响应,浏览器拿到数据后通过脚本更新图表。

我输入一条信息后,再看浏览器,会自动刷新图表。只有当我有输入后,浏览器才会更新数据。

可以看到已经变化了。我输了三次数据,浏览器就会更新三个记录。对所有用户有效。测试前,可以分别用ie ,firefox 打开到本地服务器这个页面。可以看到所有浏览器都已经更新。
结合上一篇博客说到的数据库推送技术,只要将客户端换成dll加载到 数据库触发器,便可以实现,新数据插入后,页面实时展示。
这里先把本次的demo代码贴出来。
客户端的代码,这些都是从highcharts官方贴过来的,简单修改了一些。这个图表中共有三条曲线,我发现每次同时更新三条曲线会有一个问题,highcharts的线条前进动画没了。只能一条条绘制,所以就用了fadeTogge的回调函数,竟然有效!
<head>
    <script src="http://code.jquery.com/jquery-1.7.min.js" type="text/javascript"></script>
    <script src="~/Scripts/jquery.signalR-1.0.1.min.js" type="text/javascript"></script>
    <script type="text/javascript">
        $(function () {
            var connection = $.connection('/echo');

            connection.received(function (data) {
                $('#messages').append('<li>' + data + '</li>');
                                var series = chart.series[0];
                                var series1 = chart.series[1];
                                var series2 = chart.series[2];
                                var x = (new Date()).getTime(), // current time
                                y = Math.random();
                                series.addPoint([x, y], true, true);

            });

            connection.start().done(function () {
                $("#broadcast").click(function () {
                    connection.send($('#msg').val());
                });
            });


            var chart;
            $(document).ready(function () {
                chart = new Highcharts.Chart({
                    chart: {
                        renderTo: 'container',
                        type: 'spline',
                        marginRight: 130,
                        marginBottom: 25,
                        animation: Highcharts.svg, // don't animate in old IE
                        events: {
                            load: function () {
                                // set up the updating of the chart each second
                                setInterval(function () {
                                    z = Math.random() + 3;
                                    $('#messages').fadeToggle('1', function () {
                                        series1.addPoint([x, z], true, true);
                                    });
                                    d = Math.random() + 10;
                                    $('#messages').fadeToggle('1', function () {
                                        series2.addPoint([x, d], true, true);
                                    });

                                }, 3100);
                            }
                        }
                    },
                    title: {
                        text: 'Monthly Average Temperature',
                        x: -20 //center
                    },
                    subtitle: {
                        text: 'Source: WorldClimate.com',
                        x: -20
                    },
                    xAxis: {
                        type: 'datetime',
                        tickPixelInterval: 150
                    },
                    yAxis: {
                        title: {
                            text: 'Temperature (°C)'
                        },
                        plotLines: [{
                            value: 0,
                            width: 1,
                            color: '#808080'
                        }]
                    },
                    tooltip: {
                        formatter: function () {
                            return '<b>' + this.series.name + '</b><br/>' +
                        Highcharts.dateFormat('%Y-%m-%d %H:%M:%S', this.x) + '<br/>' +
                        Highcharts.numberFormat(this.y, 2);
                        }
                    },
                    legend: {
                        layout: 'vertical',
                        align: 'right',
                        verticalAlign: 'top',
                        x: -10,
                        y: 100,
                        borderWidth: 0
                    },
                    series: [{
                        name: 'Tokyo',
                        data: (function () {
                            // generate an array of random data
                            var data = [],

                        time = (new Date()).getTime(),
                        i;
                            for (i = -19; i <= 0; i++) {
                                data.push({
                                    x: time + i * 1000,
                                    y: Math.random()
                                });
                            }
                            return data;
                        })()
                    }, {
                        name: 'BeiJing',
                        data: (function () {
                            // generate an array of random data
                            var data = [],

                        time = (new Date()).getTime(),
                        i;
                            for (i = -19; i <= 0; i++) {
                                data.push({
                                    x: time + i * 1000,
                                    y: Math.random()
                                });
                            }
                            return data;
                        })()
                    },
                    {
                        name: 'JiNan',
                        data: (function () {
                            // generate an array of random data
                            var data = [],

                        time = (new Date()).getTime(),
                        i;
                            for (i = -19; i <= 0; i++) {
                                data.push({
                                    x: time + i * 1000,
                                    y: Math.random()
                                });
                            }
                            return data;
                        })()
                    }
                    ]
                });
            });
        });
</script>
</head>
<body>
    <script src="http://code.highcharts.com/highcharts.js"></script>
    <script src="http://code.highcharts.com/modules/exporting.js"></script>
    <input type="text" id="msg" />
    <input type="button" id="broadcast" value="broadcast" />
    <ul id="messages">
    </ul>
    <div id="container" style="min-width: 400px; height: 400px; margin: 0 auto"></div>
</body>
public class DJ_Connection : PersistentConnection
    {
        protected override Task OnReceived(IRequest request, string connectionId, string data)
        {
            return Connection.Broadcast(data);
        }


}ok。再来看,console程序,模拟新数据插入响应给服务器:
using Microsoft.AspNet.SignalR.Client;

namespace Console2Web_SignalR
{
    class Program
    {
        static void Main(string[] args)
        {
            // Connect to the service
            var connection = new Connection("http://localhost:10010/echo");

            // Print the message when it comes in
            connection.Received += data => Console.WriteLine(data);

            // Start the connection
            connection.Start().Wait();

            string line = null;
            while ((line = Console.ReadLine()) != null)
            {
                // Send a message to the server
                connection.Send(line).Wait();
            }
        }
    }
}好啦,今天就这些啦。
之后会去完成真实应用相关代码。再跟大家分享。


 被折叠的 条评论
为什么被折叠?
被折叠的 条评论
为什么被折叠?
 到【灌水乐园】发言


