


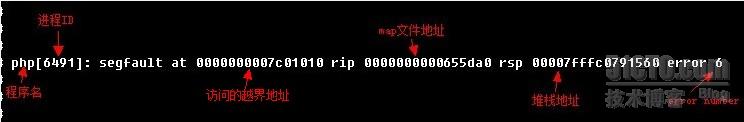
这种信息一般都是由内存访问越界造成的,不管是用户态程序还是内核态程序访问越界都会出core, 并在系统日志里面输出一条这样的信息。
这条信息的前面分别是访问越界的程序名,进程ID号,访问越界的地址以及当时进程堆栈地址等信息,比较有用的信息是最后的error number. 在上面的信息中,error number是6,
转成二进制就是110, 即bit2=1, bit1=1, bit0=0, 按照上面的解释,我们可以得出这条信息是由于用户态程序读操作访问越界造成的:
error number是由三个字位组成的,从高到底分别为bit2 bit1和bit0,所以它的取值范围是0~7.
bit2: 值为1表示是用户态程序内存访问越界,值为0表示是内核态程序内存访问越界
bit1: 值为1表示是写操作导致内存访问越界,值为0表示是读操作导致内存访问越界
bit0: 值为1表示没有足够的权限访问非法地址的内容,值为0表示访问的非法地址根本没有对应的页面,也就是无效地址
内存不足不会引起段错误,段错误通常出现在访问了非法的地址后,非法地址分为3类:
1. 访问的地址没有对应的物理内存。这类错误主要出现在越界访问,例如栈越界。比如说当前进程的栈只有5个页和它对应,共20k大小(x86平台),你访问的地址超过了这个范围,就会发生segmentation fault;
2.对地址的操作与该地址的属性不符合。例如该地址对应的内存是只读的,如文本段,你却试图进行写操作;
3.低权限访问高权限地址。这类情况发生在用户进程试图访问内核空间。例如x86中,TASK_SIZE以上的地址为内核空间,当用户态进程试图访问这些地址时,就会出现”segmentation fault“了
具体格式如下:
解决方法:
readelf -s a.out 可以查看符号表,根据rip所指的地址就能找到对应的函数了。
objdump -d a.out > a.s 可以反汇编,不但能找到函数,还能直接定位到指令。
注:本人测试没找到map文件(即a.out),故报错的程序和函数并未找到,有找到的博友可以回复告知操作过程,在此谢过!
另附上老外的原理解释:
- Well the rip pointer tells you the instruction that caused the crash. You need to look it up in a map file.
- In the map file you will have a list of functions and their starting address. When you load the application it is loaded to a base address.
- The rip pointer - the base address gives you the map file address. If you then search through the map file for a function that starts at
- an address slightly lower than your rip pointer and is followed, in the list, by a function with a higher address you have located the function that crashed.
- From there you need to try and identify what went wrong in your code. Its not much fun but it, at least, gives you a starting point.
- Edit: The "segfault at" bit is telling you, i'd wager, that you have dereferenced a NULL pointer. The rsp is the current stack pointer.
- Alas its probably not all that useful. With a memory dump you "may" be able to figure out more accurately where you'd got to in the function
- but it can be really hard to work out, exactly, where you are in an optimised build
转载于:https://blog.51cto.com/xxrenzhe/1185915


 144
144


 被折叠的 条评论
为什么被折叠?
被折叠的 条评论
为什么被折叠?
 到【灌水乐园】发言


