


 本文介绍如何使用KCacheGrind (KCG) 和Xdebug进行PHP性能分析。通过配置Xdebug生成运行时数据,并利用KCG可视化展示代码性能瓶颈,特别关注数据库操作优化。

KCacheGrind (下称KCG)是一个性能数据分析工具,由德国工程师Josef Weidendorfer, Josef.Weidendorfer@gmx.de 开发并维护,具详细信息可见: https://kcachegrind.github.io/html/Home.html
通过PHP-Xdebug扩展,我们在debug时可以生成代码运行时的数据,而通过KCG对这些运行数据进行分析,可以很直观地通过各种方式,如图形,列表等,看到每行代码每个函数所耗费的时间和资源,为代码性能优化提供依据。废话不多说,看如何实现。
1, 安装KGC
sudo apt-get install kcachegrindkcachegrind -v
Qt:4.8.7
KDE 开发平台:4.14.16
KCachegrind:0.7.4kde2, 安装Xdebug,昨天的文章已经说过了,此处不赘述。
3, 在PHP中配置Xdebug
;xdebug.profiler_enable=on
xdebug.profiler_enable_trigger=on
xdebug.trace_output_dir="/home/c80k2/xdebug"
xdebug.profiler_output_dir="/home/c80k2/xdebug/"
xdebug.profiler_append=1 #append one file
和昨天一样,我们逐项地分析各配置的含义:
①xdebug.profiler_enable=on
Type: integer, Default value: 0
Enables Xdebug's profiler which creates files in the profile output directory. Those files can be read by KCacheGrind to visualize your data. This setting can not be set in your script with ini_set(). If you want to selectively enable the profiler, please set xdebug.profiler_enable_trigger to 1 instead of using this setting.
允许Xdebug profiler会在指定的档案输出目录中生成档案文件. 那些档案文件可以用KCG来读取并可视化你的数据。此设置不可以在你的脚本中用 ini_set()方法进行设置。如果你想有选择性地允许这个profiler,请将 xdebug.profiler_enable_trigger 设置为1,而不要用此项设置。(意思是,如果你只想针对特定的php请求或运行生成档案文件时,用trigger设置。如果你用了本设置,则xdebug会对每一个php请求或运行生成档案文件。)
②xdebug.profiler_enable_trigger=on
Type: integer, Default value: 0
When this setting is set to 1, you can trigger the generation of profiler files by using the XDEBUG_PROFILE GET/POST parameter, or set a cookie with the name XDEBUG_PROFILE. This will then write the profiler data to defined directory. In order to prevent the profiler to generate profile files for each request, you need to set xdebug.profiler_enable to 0. Access to the trigger itself can be configured through xdebug.profiler_enable_trigger_value.
当此项设为1时,你可以通过使用XDEBUG_PROFILE GET/POST请求参数(即在GET/POST请求中加入一个名为XDEBUG_PROFILE的参数,值为1)或者通过设置一个名字为XDEBUG_PROFILE的cookie 来启动档案文件的生成。此时将会在预先设置的目录中生成档案文件。为了防止profiler对每一个请求都生成档案文件,你需要将 xdebug.profiler_enable 设置为0。是否使用triggle本身可以通过 xdebug.profiler_enable_trigger_value进行配置。
③xdebug.profiler_enable_trigger_value
Type: string, Default value: "", Introduced in Xdebug >= 2.3
This setting can be used to restrict who can make use of the XDEBUG_PROFILE functionality as outlined in xdebug.profiler_enable_trigger. When changed from its default value of an empty string, the value of the cookie, GET or POST argument needs to match the shared secret set with this setting in order for the profiler to start.
此项设置可以用来约束哪些人可以使用 在xdebug.profiler_enable_trigger规划的 XDEBUG_PROFILE 功能。当将它的空字符串默认值改变之后,此cookie的值,GET或POST需要和此项设置去匹配这个共享的秘密设置,以便让profiler启动。
④xdebug.trace_output_dir=''
Type: string, Default value: /tmp
The directory where the tracing files will be written to, make sure that the user who the PHP will be running as has write permissions to that directory.
轨迹文件将被写入的目录路径,确保PHP运行用户对此目录拥有写权限。
⑤xdebug.profiler_output_dir=''
Type: string, Default value: /tmp
The directory where the profiler output will be written to, make sure that the user who the PHP will be running as has write permissions to that directory. This setting can not be set in your script with ini_set().
档案文件将被写入的目录路径,,确保PHP运行用户对此目录拥有写权限。此设置不能在你的脚本中通过ini_set()方法进行设置。
⑥xdebug.profiler_append=1
Type: integer, Default value: 0
When this setting is set to 1, profiler files will not be overwritten when a new request would map to the same file (depending on the xdebug.profiler_output_name setting. Instead the file will be appended to with the new profile.
当此项设为1时,当有一个新请求的档案文件映射到相同的(已存在的)档案文件时,该档案文件讲不会被重写(重写在这里的意思是:清空文件原来的内容并写入新的内容),而是会将新内容追加到原文件内容的后面。(这取决于 xdebug.profiler_output_name 配置。相应地 原文件将会附加到新文件。)
⑦xdebug.profiler_output_name
Type: string, Default value: cachegrind.out.%p
This setting determines the name of the file that is used to dump traces into. The setting specifies the format with format specifiers, very similar to sprintf() and strftime(). There are several format specifiers that can be used to format the file name.
See the xdebug.trace_output_name documentation for the supported specifiers.
此项设置决定了写入运行轨迹的档案文件的名称。它用格式生成器规定了文件名称的格式,和 sprintf()及strftime()方法非常相似。有好几个格式生成器可用来格式化文件名称。
以上就是xdebug在php中的配置。完成后,重启php,我们就可以开始用KGC来分析档案文件了.
5, KGC分析
我们可以先用一个请求来生成档案文件,如下图:
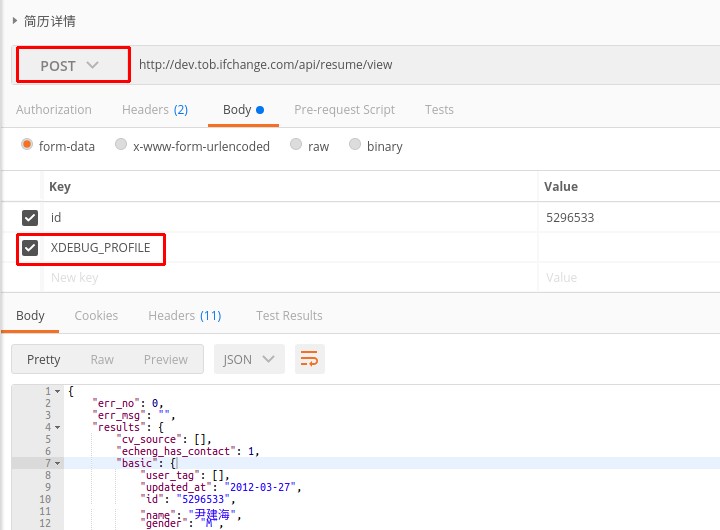
然后在输出目录中可以看到:
c80k2@c80k2-Vostro-3667❯~/xdebug$ ls -al
总用量 1700
drwxrwxrwx  2 c80k2    c80k2       4096 3月  28 11:38 .
drwxr-xr-x 69 c80k2    c80k2       4096 3月  28 11:37 ..
-rw-r--r--  1 www-data www-data 1731090 3月  28 11:38 cachegrind.out.12653
已经生成了一个档案文件。
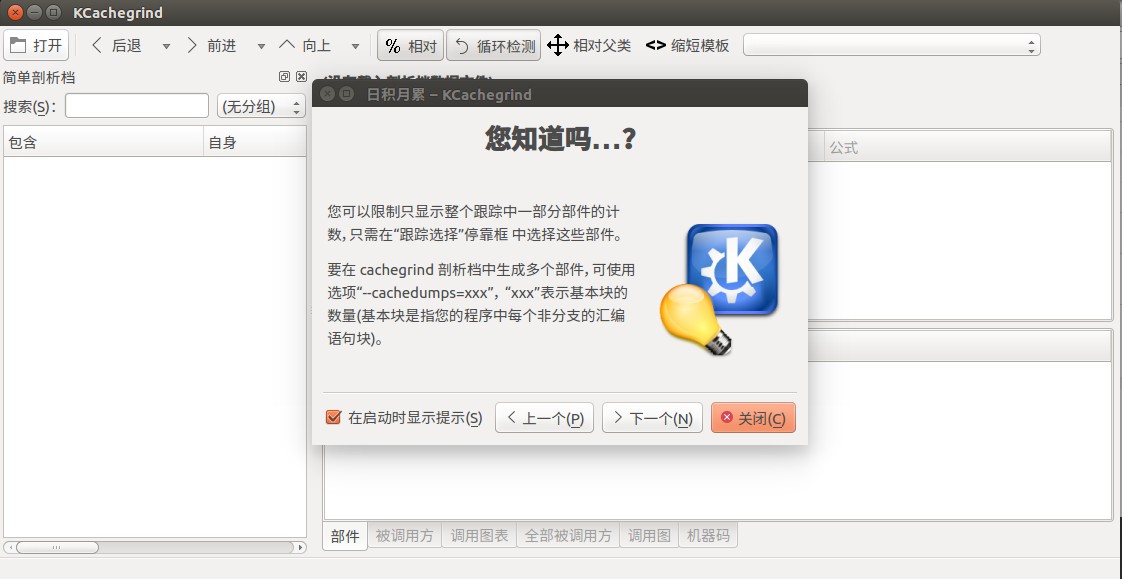
打开KGC
kcachegrind看到以下图形化界面
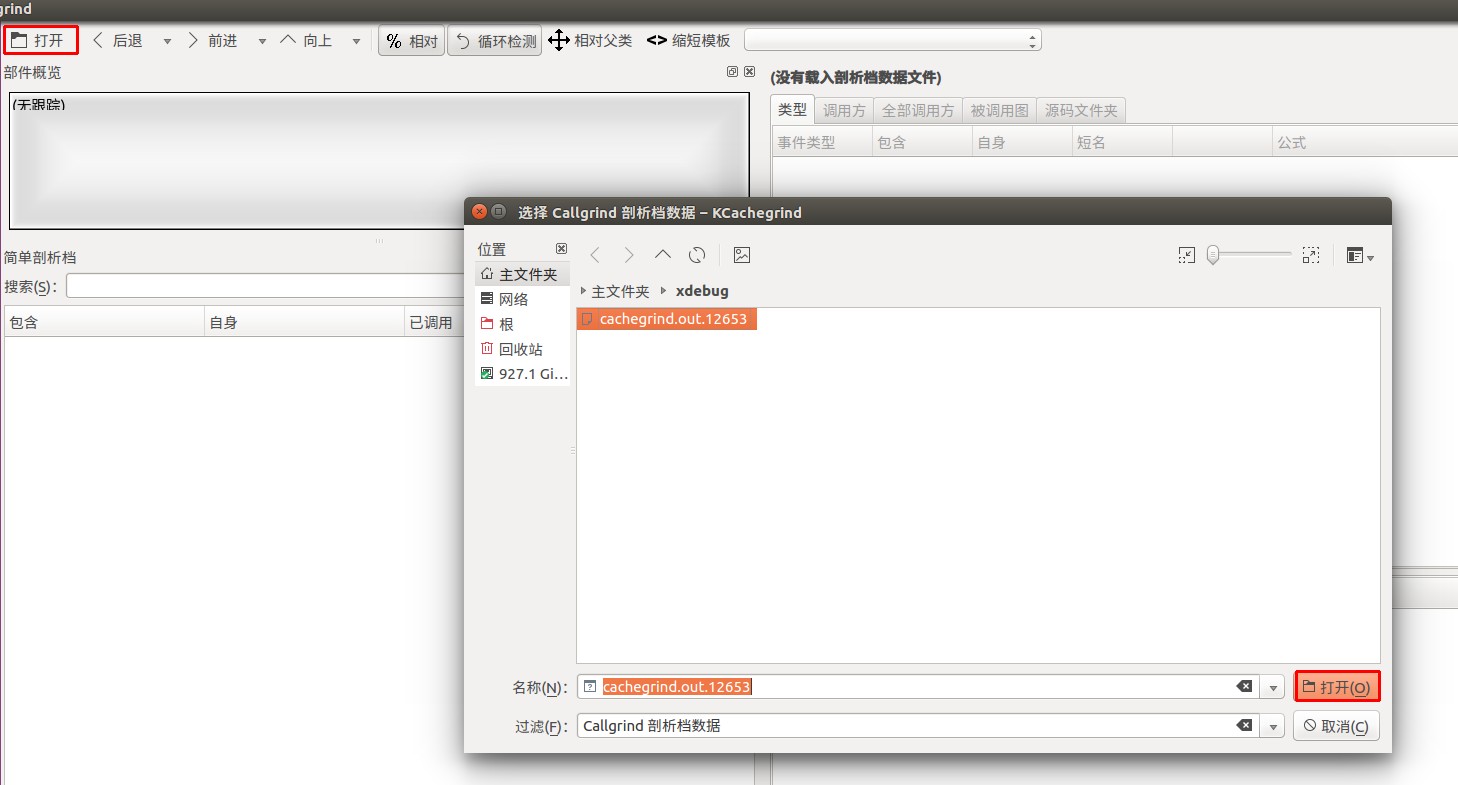
打开档案文件
点 自身 ,可以看到按照 开销 进行倒序排列,我们选择其中的一个不是系统的方法->全部调用方
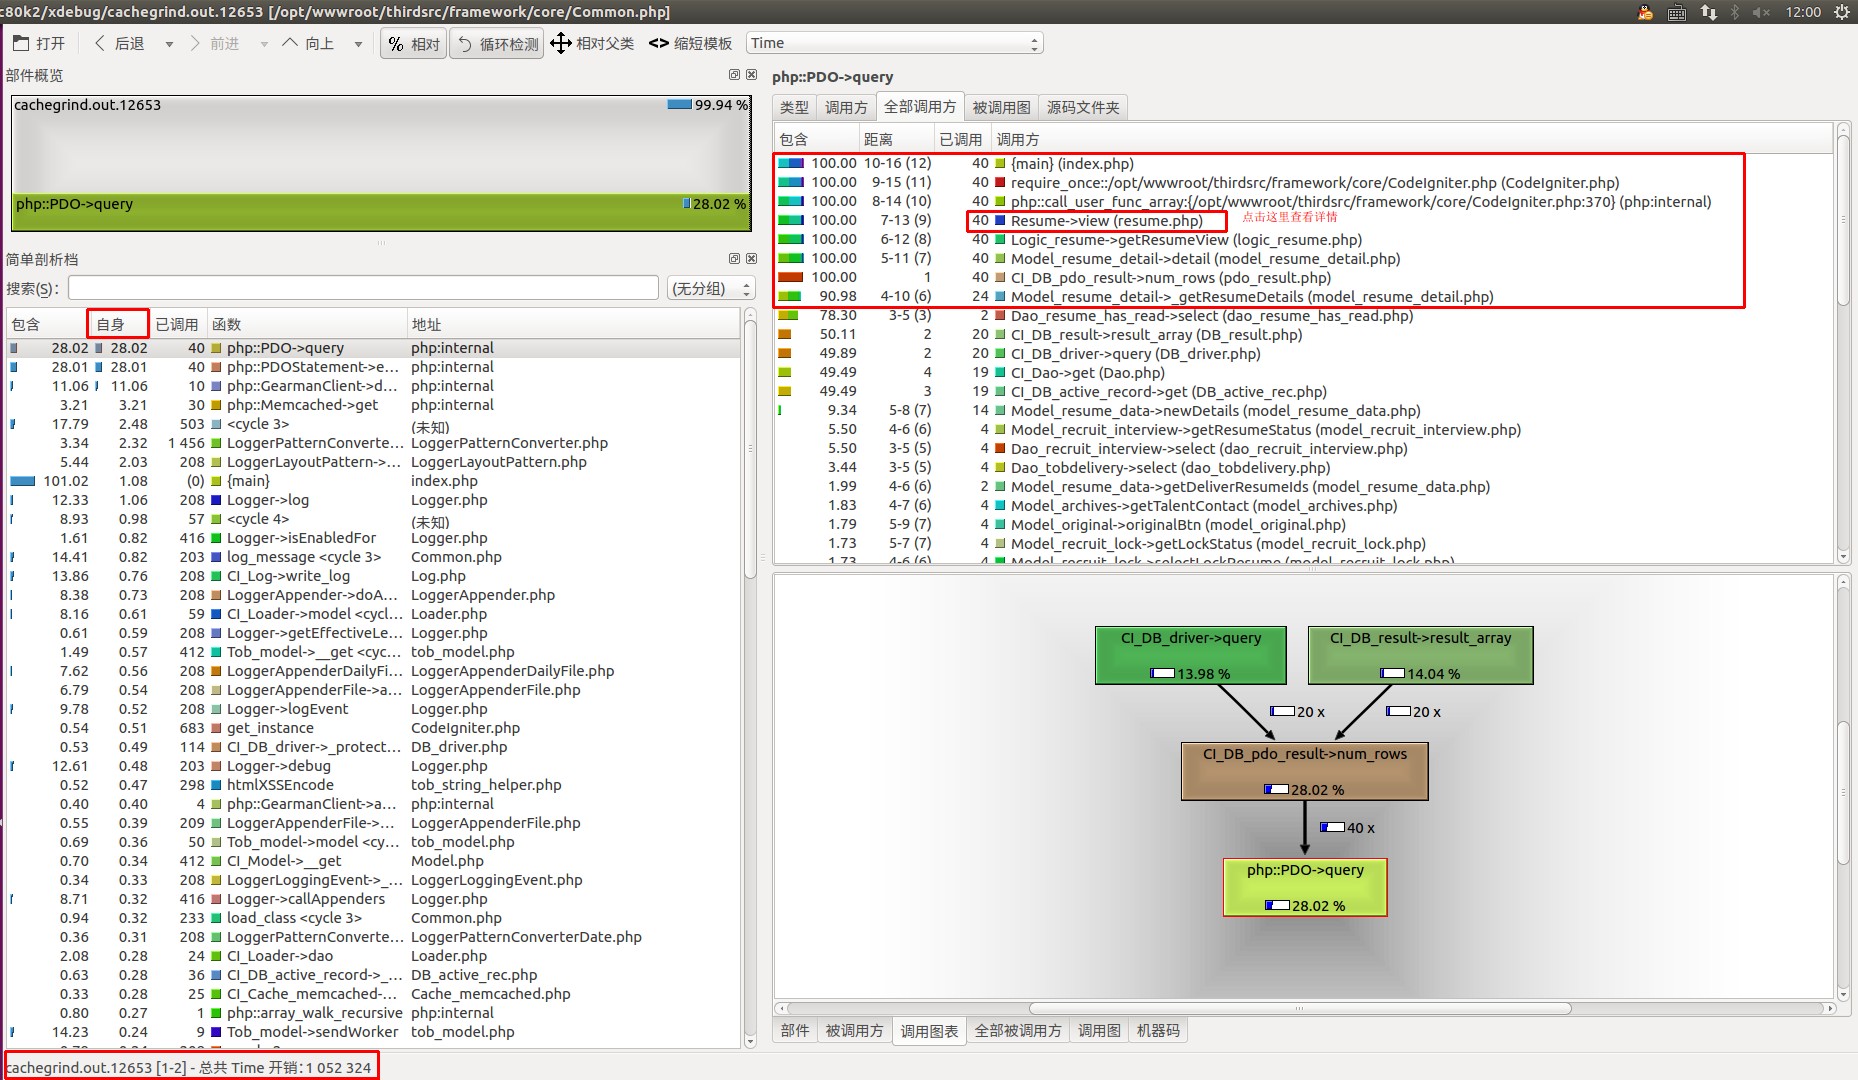
可以看到资源消耗比例如下:
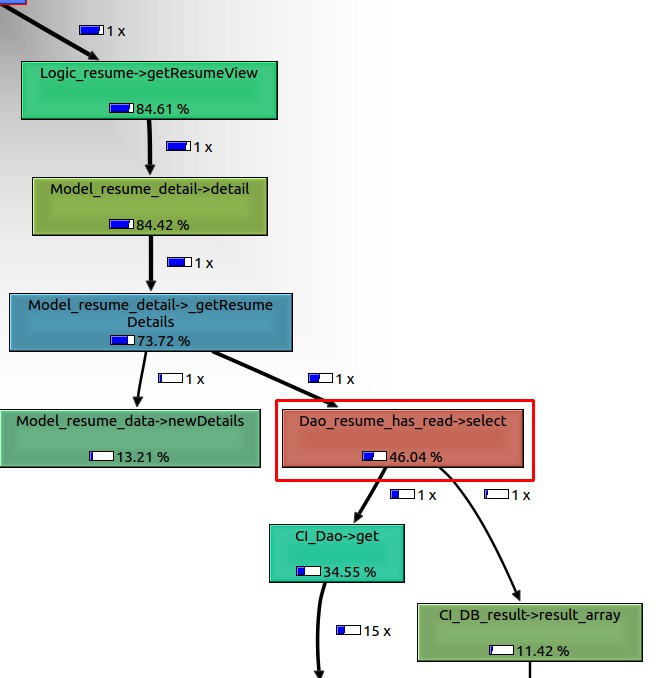
其中的select()方法
我们再进到代码中查看
...
else if ($echengHasContact) {
		    $param =array();
			$param['where']['equal']['uid'] = $uid;
			$param['where']['equal']['resume_id'] = $resumeId;
			//$res = array_pop($this->dao('resume/Dao_resume_view_history')->select($param));
			$res = array_pop($this->dao('resume/Dao_resume_has_read')->select($param));
...
从数据表中查询记录,一个很普通的DB操作,我们来分析一下为什么它消耗了很多资源。
第一反应是,索引。查看表结构。
mysql> show create table resume_has_read;
+-----------------+-----------------------------------------------------------------------------------------------------------------------------------------------------------------------------------------------------------------------------------------------------------------------------------------------------------------------------------------------------------------------------------------------------------------------------------------------------+
| Table           | Create Table                                                                                                                                                                                                                                                                                                                                                                                                                                        |
+-----------------+-----------------------------------------------------------------------------------------------------------------------------------------------------------------------------------------------------------------------------------------------------------------------------------------------------------------------------------------------------------------------------------------------------------------------------------------------------+
| resume_has_read | CREATE TABLE `resume_has_read` (
  `id` int(11) NOT NULL AUTO_INCREMENT,
  `uid` int(11) NOT NULL DEFAULT '0' COMMENT '用户UID',
  `position_id` int(11) NOT NULL DEFAULT '0' COMMENT '职位ID',
  `resume_id` int(11) NOT NULL DEFAULT '0' COMMENT '简历ID',
  `type` tinyint(4) NOT NULL DEFAULT '0' COMMENT '简历类型',
  PRIMARY KEY (`id`)
) ENGINE=InnoDB AUTO_INCREMENT=176715 DEFAULT CHARSET=utf8 COMMENT='简历是否被查看'                  |
可以看到,没有索引。这当然会消耗很多资源。
从另一个视角来看,一个很常用的接口,兜兜转转,竟然调用了600+个方法,但是主要的消耗还是在DB操作和gearman服务中。
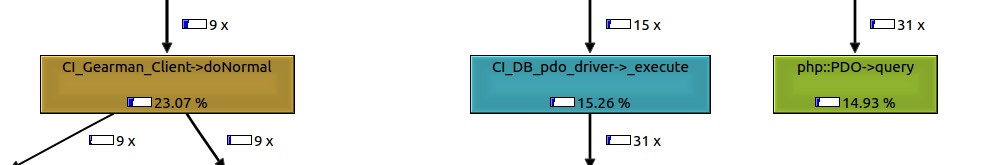
这就给我们进行代码优化的方向。


 1463
1463

 被折叠的 条评论
为什么被折叠?
被折叠的 条评论
为什么被折叠?
 到【灌水乐园】发言


