动态标绘API 1.1版本号。相较前一版本号1.0(点击进入)。该版本号提供标绘符号的编辑功能。
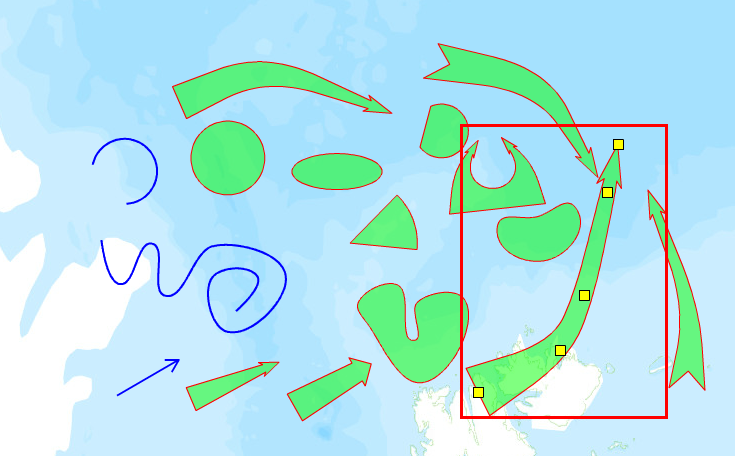
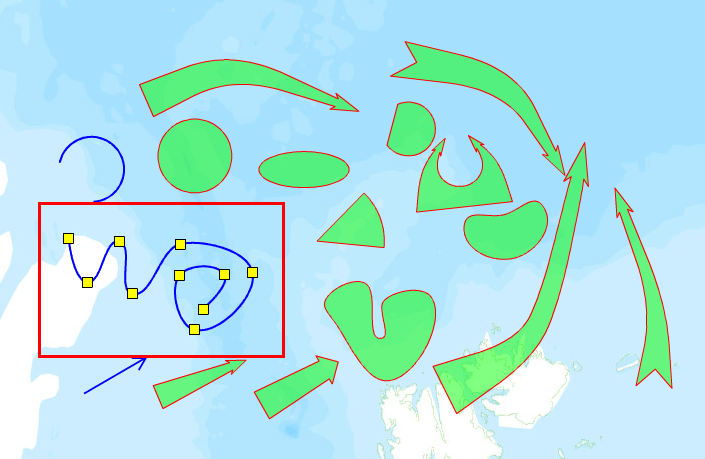
编辑功能包含两种编辑状态:编辑控制点。对标绘符号进行旋转、八方向拉伸、平移。
编辑控制点例如以下图所看到的:

对标绘符号进行旋转、八方向拉伸、平移,例如以下图所看到的:

代码演示样例
private var plotDrawTool:PlotDrawTool;
private var plotEditTool:PlotEditTool;

private var lineSymbol:SimpleLineSymbol = new SimpleLineSymbol("solid", 0x0000ff, 1, 2);
private var outline:SimpleLineSymbol = new SimpleLineSymbol("solid", 0xff0000, 1, 1);
private var fillSymbol:SimpleFillSymbol = new SimpleFillSymbol("solid", 0x00ff00, 0.5, outline);

private static const STATE_MOVE_SCALE_ROTATE:int = 0;
private static const STATE_EDIT_CONTROL_POINTS:int = 1;

private var editState:int = 0;
private var activePlot:Graphic;

private function init():void{
	// 实例化绘制工具
	this.plotDrawTool = new PlotDrawTool(map);
	// 监听 DRAW_END事件,绘制结束后可获得plot
	this.plotDrawTool.addEventListener(PlotDrawEvent.DRAW_END, drawEndHandler);
	// 实例化编辑工具
	this.plotEditTool = new PlotEditTool(map);
}

private function drawEndHandler(event:PlotDrawEvent):void{
	// 对plot设置渲染符号
	if(event.plotGraphic.geometry is Polygon)
		event.plotGraphic.symbol = fillSymbol;
	else if(event.plotGraphic.geometry is Polyline)
		event.plotGraphic.symbol = lineSymbol;
	// 显示
	this.graphicsLayer.add(event.plotGraphic);
	// 设置鼠标单击事件响应
	event.plotGraphic.addEventListener(MouseEvent.CLICK, graphicClickHandler);
}

private function graphicClickHandler(event:MouseEvent):void{
	var graphic:Graphic = event.currentTarget as Graphic;
	if(graphic == this.activePlot){
		if(this.editState == STATE_MOVE_SCALE_ROTATE){
			// 开启 移动+编辑控制点 状态
			this.plotEditTool.activate(PlotEditTool.MOVE|PlotEditTool.EDIT_CONTROL_POINTS, graphic);
			this.editState = STATE_EDIT_CONTROL_POINTS;
		}
		else{
			// 开启 移动+旋转缩放 状态
			this.plotEditTool.activate(PlotEditTool.MOVE|PlotEditTool.SCALE_ROTATE, graphic);
			this.editState = STATE_MOVE_SCALE_ROTATE;
		}
	}
	else{
		this.activePlot = graphic;
		this.plotEditTool.activate(PlotEditTool.MOVE|PlotEditTool.EDIT_CONTROL_POINTS, graphic);
		this.editState = STATE_EDIT_CONTROL_POINTS;
	}
}

]]>
</fx:Script>
<ns:Map id="map" level="5">
        <ns:ArcGISTiledMapServiceLayer url="http://map.geoq.cn/ArcGIS/rest/services/ChinaOnlineCommunity/MapServer"/>
	<ns:GraphicsLayer id="graphicsLayer"/>
</ns:Map>
<s:Group left="50" top="20">
	<s:Rect width="100%" height="100%">
		<s:fill>
			<s:SolidColor color="0xcccccc" alpha="0.7"/>
		</s:fill>
	</s:Rect>
	<s:VGroup paddingBottom="10" paddingTop="10" paddingLeft="10" paddingRight="10">
		<s:HGroup verticalAlign="middle">
			<s:Label text="线标"/>
			<s:Button label="圆弧" click="{plotDrawTool.activate(PlotTypes.ARC)}"/>
			<s:Button label="曲线" click="{plotDrawTool.activate(PlotTypes.CURVE)}"/>
		</s:HGroup>
		<s:HGroup verticalAlign="middle">
			<s:Label text="面标"/>
			<s:Button label="圆形" click="{plotDrawTool.activate(PlotTypes.CIRCLE)}"/>
			<s:Button label="椭圆" click="{plotDrawTool.activate(PlotTypes.ELLIPSE)}"/>
			<s:Button label="弓形" click="{plotDrawTool.activate(PlotTypes.LUNE)}"/>
			<s:Button label="扇形" click="{plotDrawTool.activate(PlotTypes.SECTOR)}"/>
			<s:Button label="闭合曲线" click="{plotDrawTool.activate(PlotTypes.CLOSED_CURVE)}"/>
			<s:Button label="集结地" click="{plotDrawTool.activate(PlotTypes.GATHERING_PLACE)}"/>
		</s:HGroup>
		<s:HGroup verticalAlign="middle">
			<s:Label text="箭头"/>
			<s:Button label="直箭头" click="{plotDrawTool.activate(PlotTypes.STRAIGHT_ARROW)}"/>
			<s:Button label="细直箭头" click="{plotDrawTool.activate(PlotTypes.FINE_ARROW)}"/>
			<s:Button label="袭击方向" click="{plotDrawTool.activate(PlotTypes.ASSAULT_DIRECTION)}"/>
			<s:Button label="进攻方向" click="{plotDrawTool.activate(PlotTypes.ATTACK_ARROW)}"/>
			<s:Button label="进攻方向(尾)" click="{plotDrawTool.activate(PlotTypes.TAILED_ATTACK_ARROW)}"/>
			<s:Button label="钳击" click="{plotDrawTool.activate(PlotTypes.DOUBLE_ARROW)}"/>
			<s:Button label="分队战斗" click="{plotDrawTool.activate(PlotTypes.SQUAD_COMBAT)}"/>
			<s:Button label="分队战斗(尾)" click="{plotDrawTool.activate(PlotTypes.TAILED_SQUAD_COMBAT)}"/>
		</s:HGroup>
	</s:VGroup>
</s:Group>
演示样例代码下载地址 最新版本号
欢迎大家使用、反馈意见。
QQ:21587252 email:gispace@yeah.net


 8106
8106

 被折叠的 条评论
为什么被折叠?


