


JFreeChart localChart = ChartFactory.createTimeSeriesChart("洪水预报图形界面",
"时间(小时)", "流量(mm)", xyDataset, true, true, false);
localChart.addSubtitle(new TextTitle(" ------金家坝水电站", new Font(
"Dialog", Font.ITALIC, 12)));
TextTitle title = localChart.getTitle();
title.setFont(new Font("宋体", Font.BOLD, 24));
localChart.setBackgroundPaint(Color.BLACK);
//获取LegendTitle对象(就是图示那个区域对象)
LegendTitle legend = localChart.getLegend();
//legend.setItemFont(new Font("宋体", Font.ITALIC, 12));
legend.setPosition(RectangleEdge.BOTTOM);
legend.setBackgroundPaint(Color.WHITE);//背景色
legend.setHeight(100.00);//高度
legend.setItemLabelPadding(RectangleInsets.ZERO_INSETS);
legend.setItemPaint(Color.blue);
//legend.setItemFont(new Font("宋体",Font.PLAIN,12));
legend.setLegendItemGraphicEdge(RectangleEdge.RIGHT);//图例小图形的位置
legend.setLegendItemGraphicLocation(RectangleAnchor.BOTTOM_RIGHT);//图例小图形的位置
legend.setLegendItemGraphicPadding(RectangleInsets.ZERO_INSETS);
//定义图表背景图案
localChart.setBackgroundPaint(new GradientPaint(0, 0, Color.BLACK, 1200, 0, Color.yellow));
localChart.setBackgroundPaint(Color.WHITE);
XYPlot plot = (XYPlot) localChart.getPlot();
plot.setBackgroundPaint(null);
plot.setBackgroundPaint(new Color(235, 233, 220));// 设置数据区(中间部分背景色)
plot.setDomainGridlinesVisible(true);// x轴分类轴网格是否可见
plot.setDomainGridlinePaint(Color.BLACK);//x轴虚线色彩
plot.setRangeGridlinesVisible(true);// y轴数据轴网格是否可见
plot.setRangeGridlinePaint(Color.RED);//y轴虚线色彩
plot.setDomainGridlinesVisible(true);// x轴分类轴网格是否可见
plot.setDomainGridlinePaint(Color.BLACK);// 虚线色彩
plot.setRangeGridlinesVisible(true);// y轴数据轴网格是否可见
plot.setRangeGridlinePaint(Color.BLACK);// 虚线色彩
// X 轴
DateAxis xAxis = (DateAxis) plot.getDomainAxis();
xAxis.setLabelFont(new Font("宋体", Font.PLAIN, 12));
xAxis.setLabelPaint(Color.BLUE);
SimpleDateFormat fmt = new SimpleDateFormat("k:mm");
xAxis.setTickUnit(new DateTickUnit(DateTickUnit.HOUR, 2, fmt));
xAxis.setAutoRange(true);
//xAxis.setTickMarksVisible(false);
xAxis.setTickMarkPaint(Color.red);//设置x轴刻度尺颜色
//xAxis.setLabelAngle(45.00d);//x轴标题旋转角度
xAxis.setTickMarkInsideLength(5.2f);//刻度尺的长度
xAxis.setTickMarkOutsideLength(5.5f);//刻度尺的长度
// Y 轴
ValueAxis yAxis = plot.getRangeAxis();
yAxis.setLabelFont(new Font("宋体", Font.PLAIN, 12));
yAxis.setLabelPaint(Color.BLUE);
yAxis.setLowerBound(0);
yAxis.setUpperBound(1000);
yAxis.setTickMarksVisible(true);//设置图示是否显示
yAxis.setLowerMargin(0.01);// 设置距离图片左端距离此时为10%
yAxis.setUpperMargin(0.01);// 设置距离图片右端距离此时为百分之10
yAxis.setLabelFont(new Font("黑体", Font.BOLD, 12));// Y轴标题字体
yAxis.setTickLabelFont(new Font("黑体", Font.BOLD, 12));
NumberFormat numberformat = new DecimalFormat("00%");
((NumberAxis) yAxis).setNumberFormatOverride(numberformat);// 设置y轴以百分比方式显示
//配置字体
Font xlabelfont = new Font("宋体",Font.PLAIN,12) ;// x轴标题字体
Font xtickfont = new Font("宋体",Font.PLAIN,12) ;// x轴刻度字体
Font ylabelfont = new Font("宋体",Font.PLAIN,12) ;// Y轴标题字体
Font ytickfont = new Font("宋体",Font.PLAIN,12) ;// Y轴刻度字体
Font titleFont = new Font("宋体", Font.PLAIN , 25) ; // 图片标题
Font itemfont = new Font("宋体",Font.PLAIN,15) ;// 图示字体
plot.getDomainAxis().setLabelFont(xlabelfont); //x轴标题字体
plot.getDomainAxis().setTickLabelFont(xtickfont); //x轴刻度字体
plot.getRangeAxis().setLabelFont(ylabelfont); //y轴外围字体
plot.getRangeAxis().setTickLabelFont(ytickfont); //y轴标题字体
localChart.getTitle().setFont(titleFont); //设置标题字体
localChart.getLegend().setItemFont(itemfont); //设置最底下方框内的字体(图示Legend)
//抗锯齿关闭
localChart.getRenderingHints().put(RenderingHints.KEY_TEXT_ANTIALIASING,RenderingHints.VALUE_TEXT_ANTIALIAS_OFF);
以上是单个图形的处理。
组合图形:
private static JFreeChart createCombinedChart(IntervalXYDataset data1,XYDataset data2)
{
XYLineAndShapeRenderer xylineandshaperenderer = new XYLineAndShapeRenderer(true, false);
xylineandshaperenderer.setBaseToolTipGenerator(new StandardXYToolTipGenerator("{0}: ({1}, {2})", new SimpleDateFormat("d-MMM-yyyy"), new DecimalFormat("0.00")));
xylineandshaperenderer.setSeriesStroke(0, new BasicStroke(4F, 1, 2));
xylineandshaperenderer.setSeriesPaint(0, Color.blue);
DateAxis dateaxis = new DateAxis(xString);
dateaxis.setLowerMargin(0.0D);
dateaxis.setUpperMargin(0.02D);
dateaxis.setLabelFont(Lablefont);
SimpleDateFormat fmt = new SimpleDateFormat("k:mm");
dateaxis.setTickUnit(new DateTickUnit(DateTickUnit.HOUR, 2, fmt));
NumberAxis numberaxis = new NumberAxis(y1String);
numberaxis.setLabelFont(Lablefont);
xyPlot = new XYPlot(data2, null, numberaxis, xylineandshaperenderer);
renderer = xyPlot.getRenderer();
xyPlot.setBackgroundPaint(Color.lightGray);
xyPlot.setDomainGridlinePaint(Color.white);
xyPlot.setRangeGridlinePaint(Color.white);
XYBarRenderer _lcls1 = new XYBarRenderer();
_lcls1.setSeriesPaint(0, Color.red);
_lcls1.setDrawBarOutline(false);
_lcls1.setBaseToolTipGenerator(new StandardXYToolTipGenerator("{0}: ({1}, {2})", new SimpleDateFormat("d-MMM-yyyy"), new DecimalFormat("0.00")));
NumberAxis numberaxis1 = new NumberAxis(y2String);
numberaxis1.setLabelFont(Lablefont);
xyPlot1 = new XYPlot(data1, null,numberaxis1, _lcls1);
renderer1= xyPlot1.getRenderer();
xyPlot1.setBackgroundPaint(Color.lightGray);
xyPlot1.setDomainGridlinePaint(Color.white);
xyPlot1.setRangeGridlinePaint(Color.white);
xyPlot1.getRangeAxis().setInverted(true);
CombinedDomainXYPlot combineddomainxyplot = new CombinedDomainXYPlot(dateaxis);
combineddomainxyplot.add(xyPlot1, 1);
combineddomainxyplot.add(xyPlot, 5);
combineddomainxyplot.setGap(8D);
combineddomainxyplot.setDomainGridlinePaint(Color.white);
combineddomainxyplot.setDomainGridlinesVisible(true);
combineddomainxyplot.setDomainPannable(true);
JFreeChart jfreechart = new JFreeChart(tname, JFreeChart.DEFAULT_TITLE_FONT, combineddomainxyplot, false);
TextTitle texttitle = new TextTitle("www.sc-xn.com", new Font("Dialog", 0, 10));
texttitle.setPosition(RectangleEdge.BOTTOM);
texttitle.setHorizontalAlignment(HorizontalAlignment.RIGHT);
jfreechart.addSubtitle(texttitle);
LegendTitle legendtitle = new LegendTitle(combineddomainxyplot);
jfreechart.addSubtitle(legendtitle);
jfreechart.getLegend().setItemFont(Lablefont);
ChartUtilities.applyCurrentTheme(jfreechart);
// _lcls1.setBarPainter(new StandardXYBarPainter());
// _lcls1.setShadowVisible(false);
return jfreechart;
}
在引用的时候还得设置对象的字体。不然会出现乱码
chart=createCombinedChart(createDataset1(),createDataset2());
chart.addSubtitle(new TextTitle(" ------"+vname, new Font(titfont, Font.ITALIC, lableFontSize)));
TextTitle title = chart.getTitle();
title.setFont(new Font(titfont, Font.BOLD, titleFontSize));
chart.getLegend().setItemFont(Lablefont);
xyPlot.getDomainAxis().setLabelFont(Lablefont);
xyPlot.getRangeAxis().setLabelFont(Lablefont);
xyPlot1.getRangeAxis().setLabelFont(Lablefont);
引用全局变量取得组合图形中的单个对象。
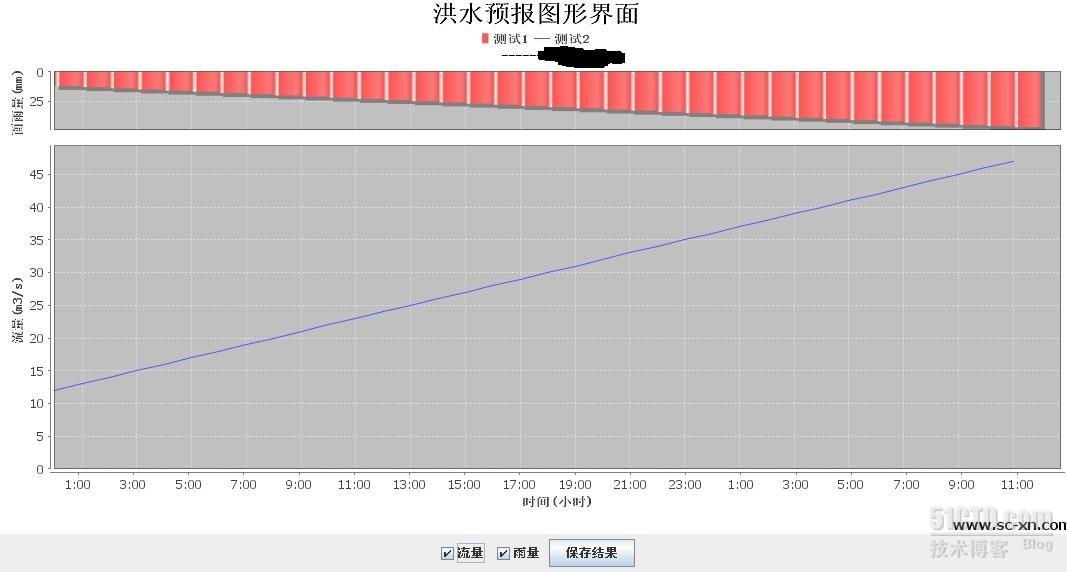
效果图:
转载于:https://blog.51cto.com/skykill/413506


 1308
1308


 被折叠的 条评论
为什么被折叠?
被折叠的 条评论
为什么被折叠?
 到【灌水乐园】发言


