


因调试某个重大问题,怀疑到了内存,专门写了个測试脚本。记录一下。
撰写不易,转载请注明出处:http://blog.csdn.net/jscese/article/details/37928823
一.调试准备
首先须要开启android系统的adb功能。start adbd
PC端 adb connect IP ADDRESS
假设 出现adb 异常能够尝试 adb kill-server 。 adb start-server
二.adb shell指令
1.查看总体内存
连上adb之后 能够通过 adb shell procrank 来查看当前的内存情况!
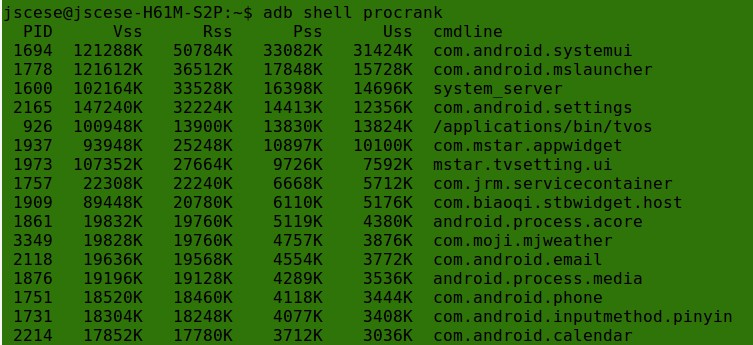
- VSS - Virtual Set Size 虚拟耗用内存(包括共享库占用的内存)
- RSS - Resident Set Size 实际使用物理内存(包括共享库占用的内存)
- PSS - Proportional Set Size 实际使用的物理内存(比例分配共享库占用的内存)
- USS - Unique Set Size 进程独自占用的物理内存(不包括共享库占用的内存)
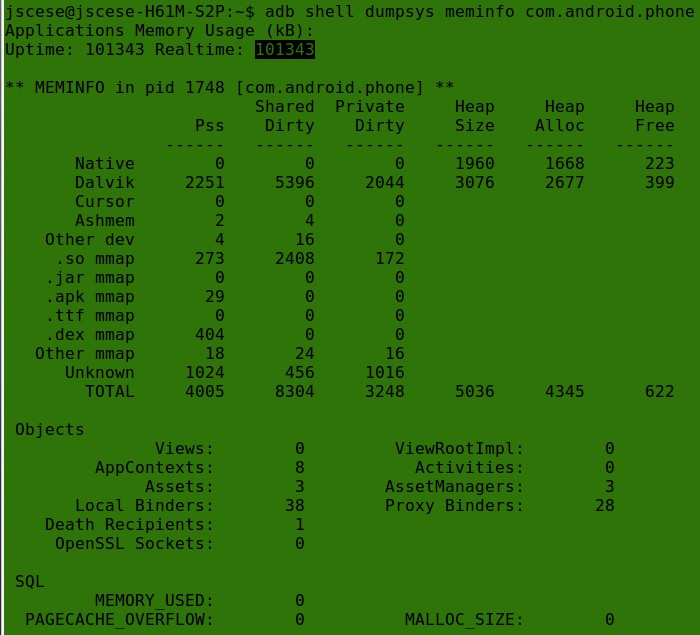
2.查看指定进程的内存情况
adb shell dumpsys meminfo (包名或者PID)
3.占用内存最多的进程或线程
adb shell top
显示当前占用最高内存的10个进程,adb shell top -m 10:

查看线程:adb shell top -t -m 10
三.shell 脚本
用于实时监控内存使用情况。而且保存log,我的shell script:
    #!/bin/bash
    echo "Begain test memory">memeory_recode.txt
    i=0
    while true; do

    adb shell procrank |grep 'RAM:'| tee -a memeory_record.txt

    memoryinfo=$(tail memeory_record.txt -n 1)
    #freememory=$memoryinfo | cut -d ' '-f 4

    freememory=`echo "$memoryinfo"|awk -F ' ' '{print $4}'`

    free=${freememory%?
} if [ $free -lt 8000 ];then echo -e "\033[31mFree Memory is $free KB Less than 8M\033[0m"| tee -a memeory_recode.txt adb shell top -m 10 -n 1 | tee -a memeory_recode.txt else echo "freememory == $free KB" fi i=$(($i+1)) sleep 1 var=$(date) echo "jscese display memory at $var the $i times" echo done
保存RAM信息的情况到 memeory_record.txt。而且解析freememory 的值,假设少于8000K就把占用内存最高的10个进程信息也保存进record。
四.build.prop中的Dalvik设置
dalvik.vm.heapstartsize=8m
dalvik.vm.heapgrowthlimit=96m
dalvik.vm.heapsize=256m
dalvik.vm.heaptargetutilization=0.75
dalvik.vm.heapminfree=512k
dalvik.vm.heapmaxfree=8m
dalvik.vm.lockprof.threshold=500
dalvik.vm.dexopt-flags=m=y
这几个属性代表了对dalvik的一些属性设置,能够在/dalvik/vm/alloc/HeapSource.cpp下找到原型:
struct HeapSource {
    /* Target ideal heap utilization ratio; range 1..HEAP_UTILIZATION_MAX
     */
    size_t targetUtilization;

    /* The starting heap size.
     */
    size_t startSize;

    /* The largest that the heap source as a whole is allowed to grow.
     */
    size_t maximumSize;

    /*
     * The largest size we permit the heap to grow.  This value allows
     * the user to limit the heap growth below the maximum size.  This
     * is a work around until we can dynamically set the maximum size.
     * This value can range between the starting size and the maximum
     * size but should never be set below the current footprint of the
     * heap.
     */
    size_t growthLimit;

    /* The desired max size of the heap source as a whole.
     */
    size_t idealSize;

    /* The maximum number of bytes allowed to be allocated from the
     * active heap before a GC is forced.  This is used to "shrink" the
     * heap in lieu of actual compaction.
     */
    size_t softLimit;

    /* Minimum number of free bytes. Used with the target utilization when
     * setting the softLimit. Never allows less bytes than this to be free
     * when the heap size is below the maximum size or growth limit.
     */
    size_t minFree;

    /* Maximum number of free bytes. Used with the target utilization when
     * setting the softLimit. Never allows more bytes than this to be free
     * when the heap size is below the maximum size or growth limit.
     */
    size_t maxFree;

...

}
大体相应的意思例如以下:
1.heapstartsize——堆初始分配的大小,一个app启动的时候分配的内存大小
2.heapgrowthlimit——分配的一个堆最大的增长值,一个app最多分配的内存大小,超出的话应该会报outofmemory
3.heapsize——整个堆所能达到的最大值。也就是应用程序所能用的内存总和
4.heaptargetutilization——代表堆的利用率,实际使用与最大利用对照
5.heapminfree——堆大小的限制因素,在堆的大小没超过限定值的情况下 最小的空暇值
6.heapmaxfree——和最小相反,堆中最多能空暇的大小
7.lockprof.threshold——调试记录程序内部锁资源争夺的阈值,默认值是500
8.dexopt-flags——程序代码的校验与优化,下面来自百科:
o为优化选项,可与v并存。能够是o=v或o=a。若o=v则表示优化以校验过的代码,o=a则表示优化全部代码。 比如: dalvik.vm.dexopt-flags=m=y dalvik.vm.dexopt-flags=v=n,o=v


 1352
1352

 被折叠的 条评论
为什么被折叠?
被折叠的 条评论
为什么被折叠?
 到【灌水乐园】发言


