1.所需jar包
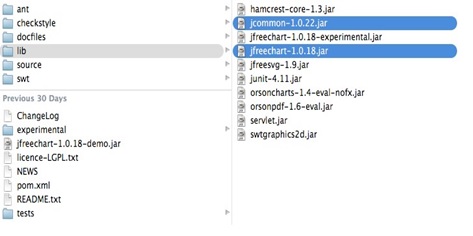
JFreeChart1.0.18.jar
jcommon-1.0.22.jar
2.JFreeChart架构
类层次架构
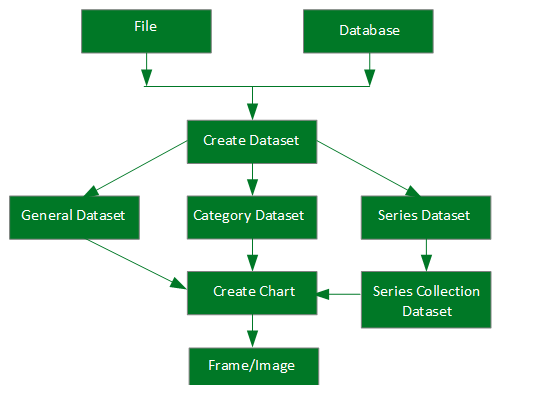
类层次架构解释了如何把不同阶层的相互库交互,以创建不同类型的图表。
 - 单元 - 描述 - 文件 - 所用的用户输入为源,用于创建该文件中的数据集。 - 数据库 - 所用的用户输入为源,用于创建在数据库中的数据集。 - 创建数据集 - 接受数据集中存储和数据集中到数据集对象。
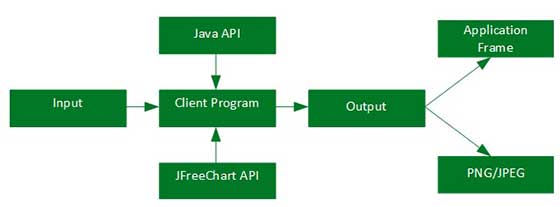
- 通用数据集 - 这种类型的数据集主要用于饼图。 - 分类数据集 - 这种类型的数据集,用于柱状图,折线图等等。 - 系列数据集 - 这种类型的数据集被用于存储一系列数据和构建线图表。 - 系列采集数据集 - 不同类别的一系列数据集添加系列集合数据集。这种类型的数据集,用于xy折线图表。 - 创建图表 - 这是被执行以创建最终的图表的方法。 - 帧、图片 - 该图显示在一个Swing框架或创建映像。 应用层框架

3.JFreeChart API
4.生成各种图表的图片代码
4.1生成饼状图
        ChartFactory.setChartTheme(StandardChartTheme.createLegacyTheme());

        DefaultPieDataset data = new DefaultPieDataset();
        // 饼状图分割数据
        data.setValue("使用率", 40);
        data.setValue("未使用率", 60);

        JFreeChart chart = ChartFactory.createPieChart(
                            title,   //标题
                            data,    //数据
                            true,    //是否生成图例
                            true,    //是否生成工具
                            false);  //是否生成链接

        // 图例标题
        LegendTitle lt = chart.getLegend();
        // 字体设定
        Font font = new Font(FONT_MSGOTHIC, Font.PLAIN, 13);
        lt.setItemFont(font);
        // 标题的外边框设定
        chart.setBorderVisible(false);
        // 背景色设定
        chart.setBackgroundPaint(Color.WHITE);
        if ( title != null ) {
            chart.getTitle().setFont( new Font( FONT_MSGOTHIC, Font.PLAIN, 14 ) );
        }

        PiePlot plot = (PiePlot) chart.getPlot();
        plot.setBackgroundPaint(Color.WHITE);
        plot.setInteriorGap(0.03);
        // 标题的内框设定
        plot.setOutlineVisible(false);

        // 每个图例的颜色设定
        plot.setSectionPaint(data.getKey(0), new Color(255, 201, 14));
        plot.setSectionPaint(data.getKey(1), new Color(144, 160, 255));

        plot.setLabelLinksVisible(false);
        plot.setSimpleLabels(true);
        plot.setLabelGenerator(new StandardPieSectionLabelGenerator("{2}"));
        plot.setLabelPaint(Color.BLACK);
        plot.setLabelBackgroundPaint(null);
        plot.setLabelOutlineStroke(null);
        plot.setShadowGenerator(new DefaultShadowGenerator(1, Color.WHITE, 1f, 0, 0d));
        plot.setShadowPaint(null);

        // 图例位置 边框设定
        LegendTitle legend = chart.getLegend();
        legend.setPosition(RectangleEdge.RIGHT);
        legend.setBorder(0, 0, 0, 0);

        // 输出方式1:PNG文件
        ChartUtilities.saveChartAsPNG(imgFile, chart, width, height);

        // 输出方式2:流,通过response传送到jsp页面
	response.setContentType("image/png");
	ChartUtilities.writeChartAsPNG(response.getOutputStream(), chart, 210, 80);
	response.getOutputStream().flush();
4.2生成柱状图
        ChartFactory.setChartTheme(StandardChartTheme.createLegacyTheme());

        DefaultCategoryDataset data = new DefaultCategoryDataset();
        data.addValue(
                    value1,    //柱状图的数值
                      str1,   //某一个分类的柱状图名字
                      str2   //某一分类名字
         );

        JFreeChart chart = ChartFactory.createBarChart(
                        title,   //柱状图标题
                        null,    //横轴标题
                        null,    //纵轴标题
                        data,    //数据
  PlotOrientation.HORIZONTAL,    //图表方向:横向
                        false,   //是否生成图例
                        true,    //是否生成工具
                        false    //是否生成链接
        );
        // 标题外边框线是否显示
        chart.setBorderVisible(false);
        // 图表的背景色
        chart.setBackgroundPaint(Color.WHITE);
        if ( title != null ) {
            chart.getTitle().setFont( new Font( FONT_MSGOTHIC, Font.PLAIN, 14 ) );
        }

        //获取绘图区对象
        CategoryPlot plot = chart.getCategoryPlot();
        plot.setBackgroundPaint(Color.WHITE);
        plot.setInteriorGap(0.03);
        plot.setOutlineVisible(false);   //>>> 内边线设定
        plot.setRangeAxisLocation(AxisLocation.BOTTOM_OR_LEFT);  //>>> 轴的位置设定

        // 横轴相关设定
        CategoryAxis cAxis = plot.getDomainAxis();
        cAxis.setTickLabelFont(new Font(FONT_MSGOTHIC, Font.PLAIN, 10));

        // 纵轴相关设定
        ValueAxis vAxis = plot.getRangeAxis();
        vAxis.setTickLabelFont(new Font(FONT_MSGOTHIC, Font.PLAIN, 11));

        // bar的设定
        BarRenderer renderer = (BarRenderer) plot.getRenderer();
        renderer.setDrawBarOutline(false);
        renderer.setShadowVisible(false);
        renderer.setItemMargin(0);  //>>> Category间的分割距离

        // 柱的宽度(ItemMargin优先)
        double barWidth = 0.08;
        switch (size) {
        case 1:
            barWidth = 0.45; break;
        case 2:
            barWidth = 0.25; break;
        }
        renderer.setMaximumBarWidth(barWidth);

        // 每个柱子的颜色设定
        renderer.setSeriesPaint(0, new Color(255, 201, 14));
        renderer.setSeriesPaint(1, new Color(255, 174, 201));

        // 横轴的设定
        CategoryAxis domAxis = plot.getDomainAxis();
        domAxis.setLowerMargin(0.04);
        domAxis.setUpperMargin(0.04);
        // 间隔设定
        domAxis.setCategoryMargin(0.08);
        // 文字的角度
        domAxis.setCategoryLabelPositions(CategoryLabelPositions.createUpRotationLabelPositions(Math.PI / 6.0));
        // label最大行数
        if (strgData.size() < 4)
            domAxis.setMaximumCategoryLabelLines(2);
        else
            domAxis.setMaximumCategoryLabelLines(1);

        domAxis.setMaximumCategoryLabelWidthRatio(0.4f);

        // 纵轴设定
        NumberAxis valueAxis = (NumberAxis)plot.getRangeAxis();
        valueAxis.setStandardTickUnits(NumberAxis.createIntegerTickUnits());  //>>> 固定整数
        valueAxis.setAutoRange(false); //>>> 值轴的范围
        valueAxis.setRange(0, 100);

        // 输出方式1:PNG文件
        ChartUtilities.saveChartAsPNG(imgFile, chart, width, height);

        // 输出方式2:流,通过response传送到jsp页面
	response.setContentType("image/png");
	ChartUtilities.writeChartAsPNG(response.getOutputStream(), chart, 210, 80);
	response.getOutputStream().flush();
4.3生成折线图
        ChartFactory.setChartTheme(StandardChartTheme.createLegacyTheme());

        DefaultCategoryDataset data = new DefaultCategoryDataset();
        data.addValue(
                    value1,    //值域的数值
                      str1,   //某一折线的名字
                      str2   //范围域的值
         );

        JFreeChart chart = ChartFactory.createLineChart(
                        title,   //折线图标题
                        null,    //横轴标题
                        null,    //纵轴标题
                        data,    //数据
  PlotOrientation.HORIZONTAL,    //图表方向:横向
                        false,   //是否生成图例
                        true,    //是否生成工具
                        false    //是否生成链接
        );
        // 标题外边框
        chart.setBorderVisible(false);
        // 背景色设定
        chart.setBackgroundPaint(Color.WHITE);
        if ( title != null ) {
            chart.getTitle().setFont( new Font( FONT_MSGOTHIC, Font.PLAIN, 14 ) );
        }

        //获取绘图区域
        CategoryPlot plot = chart.getCategoryPlot();
        plot.setBackgroundPaint(Color.WHITE);
        plot.setOutlineVisible(false);  //>>> 标题内边线设定
        plot.setRangeAxisLocation(AxisLocation.BOTTOM_OR_LEFT); //>>> 轴的位置设定

        // 横轴设定
        CategoryAxis cAxis = plot.getDomainAxis();
        cAxis.setTickLabelFont(new Font(FONT_MSGOTHIC, Font.PLAIN, 10)); //字体设定

        // 纵轴设定
        ValueAxis vAxis = plot.getRangeAxis();
        vAxis.setTickLabelFont(new Font(FONT_MSGOTHIC, Font.PLAIN, 11)); //字体设定

        // 横轴设定
        CategoryAxis domAxis = plot.getDomainAxis();
    domAxis.setCategoryLabelPositions(CategoryLabelPositions.createUpRotationLabelPositions(Math.PI / 6.0));  // label文字角度

         // 输出方式1:PNG文件
        ChartUtilities.saveChartAsPNG(imgFile, chart, width, height);

        // 输出方式2:流,通过response传送到jsp页面
	response.setContentType("image/png");
	ChartUtilities.writeChartAsPNG(response.getOutputStream(), chart, 210, 80);
	response.getOutputStream().flush();


 89
89


 被折叠的 条评论
为什么被折叠?


