


Prometheus是什么
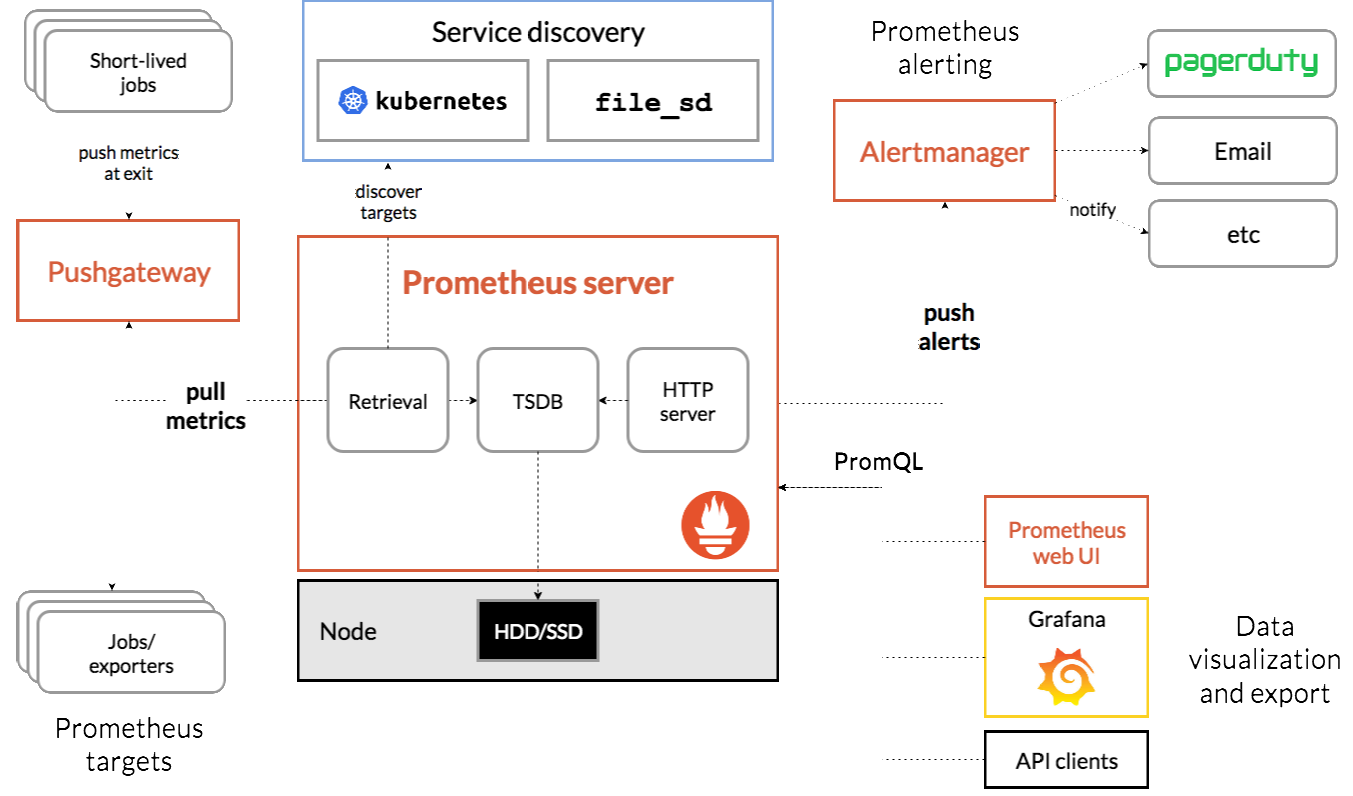
Prometheus(普罗米修斯)非常酷的开源监控系统。它支持多维度的指标数据模型,服务端通过HTTP协议定时拉取数据后,通过灵活的查询语言,实现监控的目的。
客户端记录相关指标数据,对外提供查询接口。Prometheus服务端通过服务器发现机制找到客户端,并定时抓取存储为时间序列数据。最后通过Grafana等图表工具集成展示。
Prometheus可以做什么
-
在业务层用作埋点系统
Prometheus支持各个主流开发语言(Go,java,python,ruby官方提供客户端,其他语言有第三方开源客户端)。我们可以通过客户端方面的对核心业务进行埋点。如下单流程、添加购物车流程。 -
在应用层用作应用监控系统
一些主流应用可以通过官方或第三方的导出器,来对这些应用做核心指标的收集。如redis,mysql。 -
在系统层用作系统监控
除了常用软件, prometheus也有相关系统层和网络层exporter,用以监控服务器或网络。 -
集成其他的监控
prometheus还可以通过各种exporte,集成其他的监控系统,收集监控数据,如AWS CloudWatch,JMX,Pingdom等等。
开始安装 prometheus
1 下载
https://prometheus.io/download/2 解压安装
tar xf prometheus-2.8.0.linux-amd64.tar.gz

mv prometheus-2.8.0.linux-amd64 /usr/local/prometheus

cd /usr/local/prometheus

./prometheus --version
3 启动
./prometheusnode节点安装agent
1 下载
https://prometheus.io/download/#node_exporter2 安装 agent
tar xf node_exporter-0.17.0.linux-amd64.tar.gz
cd node_exporter-0.17.0.linux-amd64
3 启动agent
./node_exporter向prometheus 注册节点
1 编辑配置文件
cd /usr/local/prometheus

# cat prometheus.yml
# my global config
global:
  scrape_interval:     15s # Set the scrape interval to every 15 seconds. Default is every 1 minute.
  evaluation_interval: 15s # Evaluate rules every 15 seconds. The default is every 1 minute.
  # scrape_timeout is set to the global default (10s).

# Alertmanager configuration
alerting:
  alertmanagers:
  - static_configs:
    - targets:
      # - alertmanager:9093

# Load rules once and periodically evaluate them according to the global 'evaluation_interval'.
rule_files:
  # - "first_rules.yml"
  # - "second_rules.yml"

# A scrape configuration containing exactly one endpoint to scrape:
# Here it's Prometheus itself.
scrape_configs:
  # The job name is added as a label `job=<job_name>` to any timeseries scraped from this config.
  - job_name: 'prometheus'

    # metrics_path defaults to '/metrics'
    # scheme defaults to 'http'.

    static_configs:
    - targets: ['localhost:9090']

  - job_name: 'linux-node'          #添加一个job
    static_configs:
      - targets: ['10.10.25.151:9100']     配置被监控的节点IP
        labels:
          instance: node1

服务端监听 9090端口  prometheus web页面 http://ServerIP:9090
客户端监听 9100端口
2 重新启动 prometheus
./prometheus3 访问web页面
http://10.10.25.110:9090
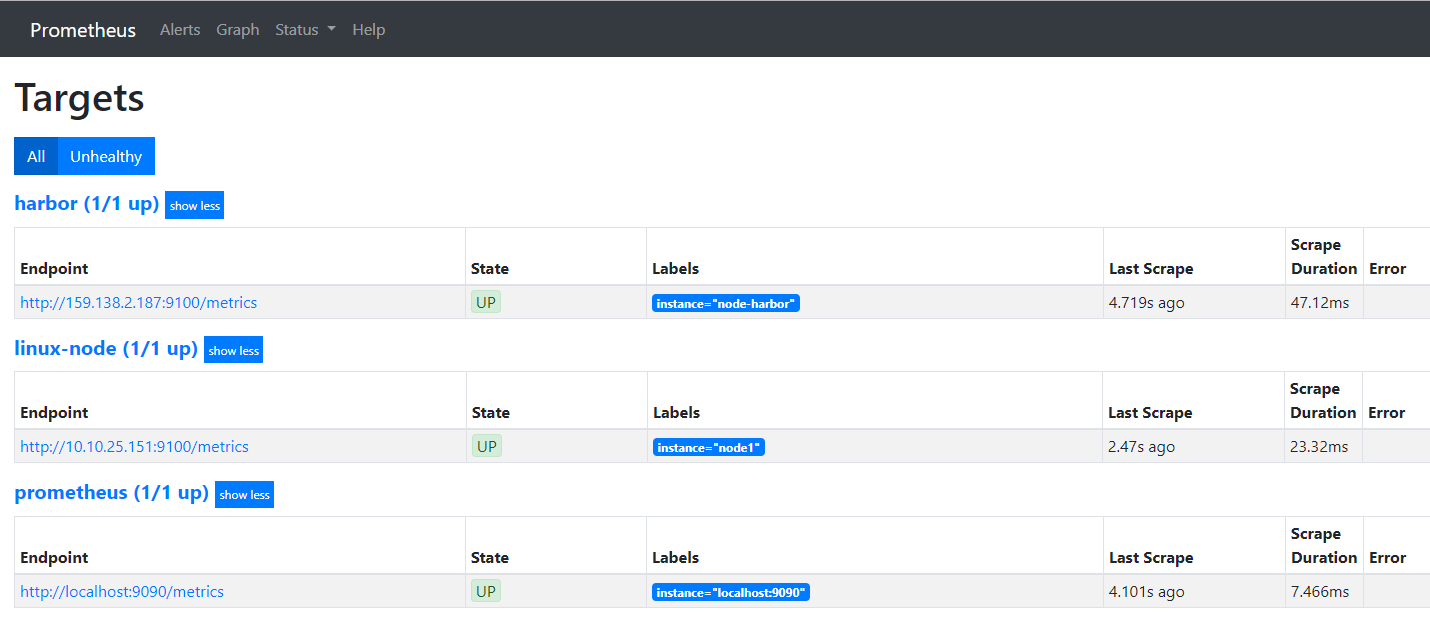
4 查看节点是否注册
选择 Status 里面的 Target可以看到我们已经注册的节点
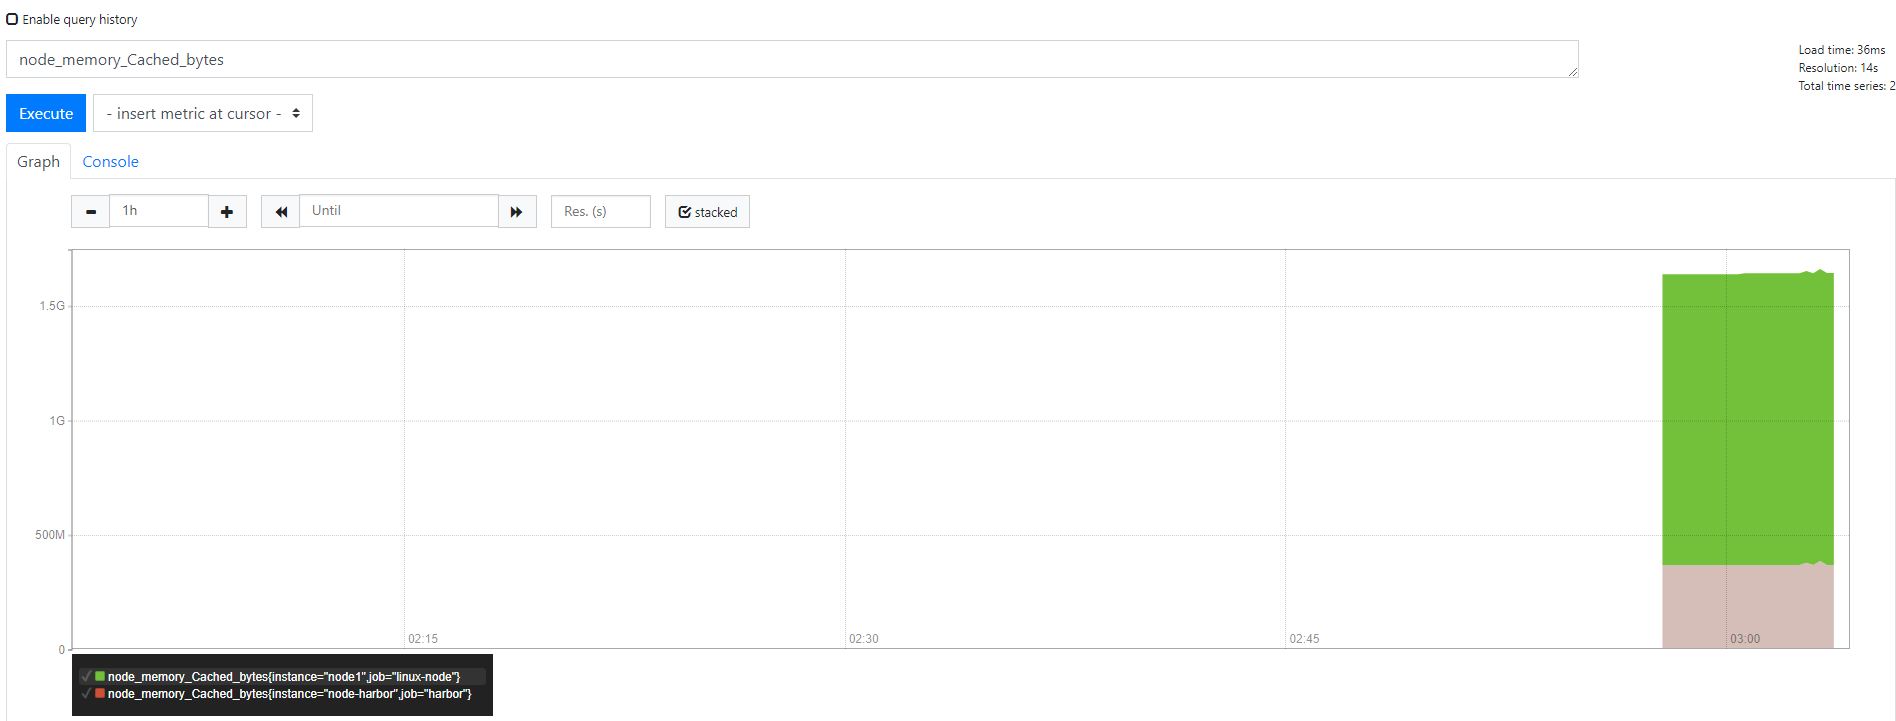
5 简单查看我们的监控指标
以内存剩余量为例在输入框输入 node_memory_Cached_bytes
什么是grafana
grafana 是一个开源的时序性统计和监控平台,支持例如 elasticsearch、graphite、influxdb 等众多的数据源,并以功能强大的界面编辑器著称。
安装grafana
1 下载
wget https://dl.grafana.com/oss/release/grafana-6.0.2-1.x86_64.rpm2 安装
yum install  grafana-6.0.2-1.x86_64.rpm
systemctl start grafana-server
systemctl enable grafana-server
grafana-server -v

grafana-server 监听端口为 3000
3 访问 grafana-server
http://ServerIP:3000
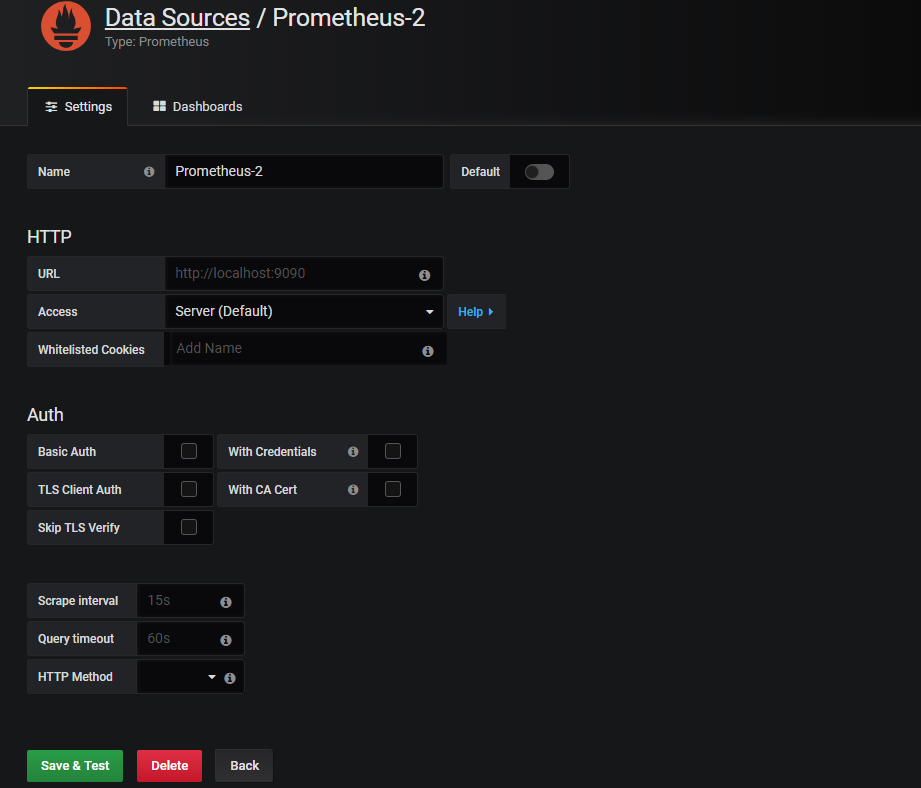
默认用户名密码为: admin admin4 添加数据源选择 Prometheus
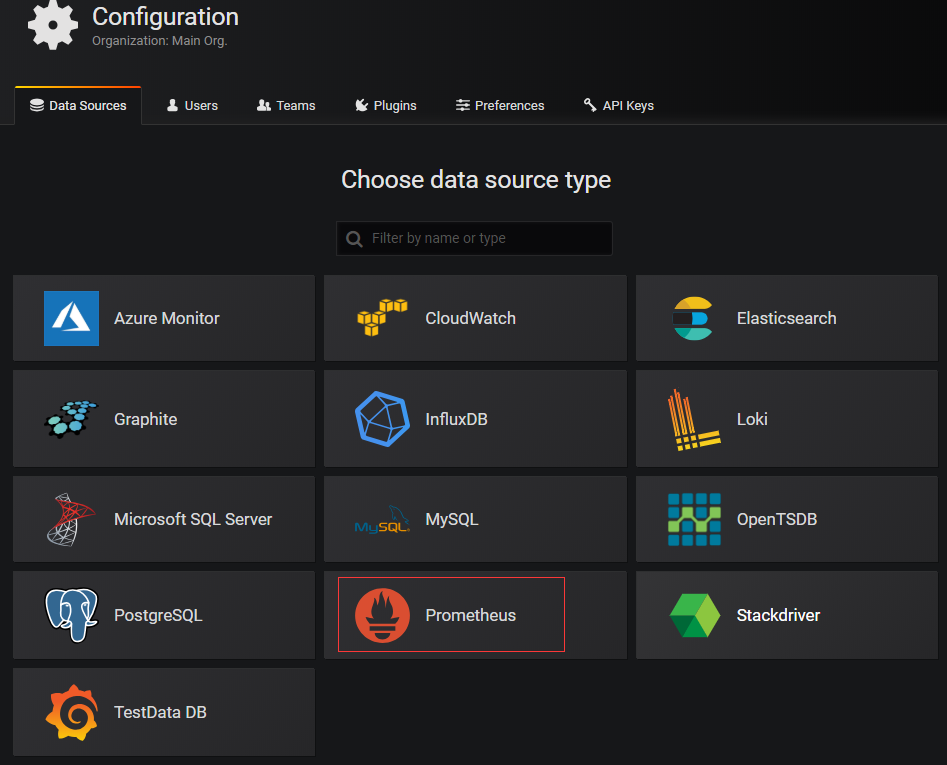
设置数据源的server地址和监听端口并保存推出
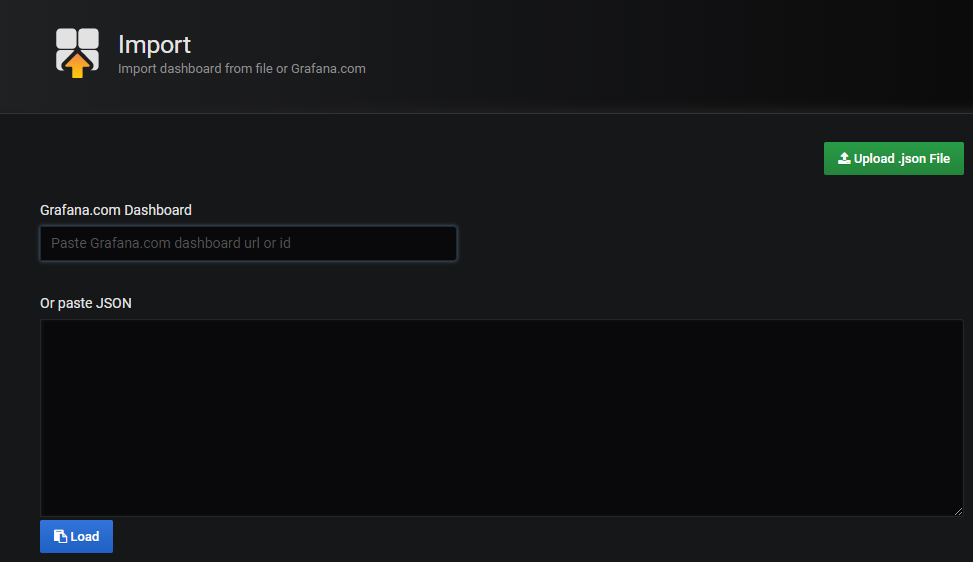
5 添加Dashboard 也就是给节点添加可视化页面
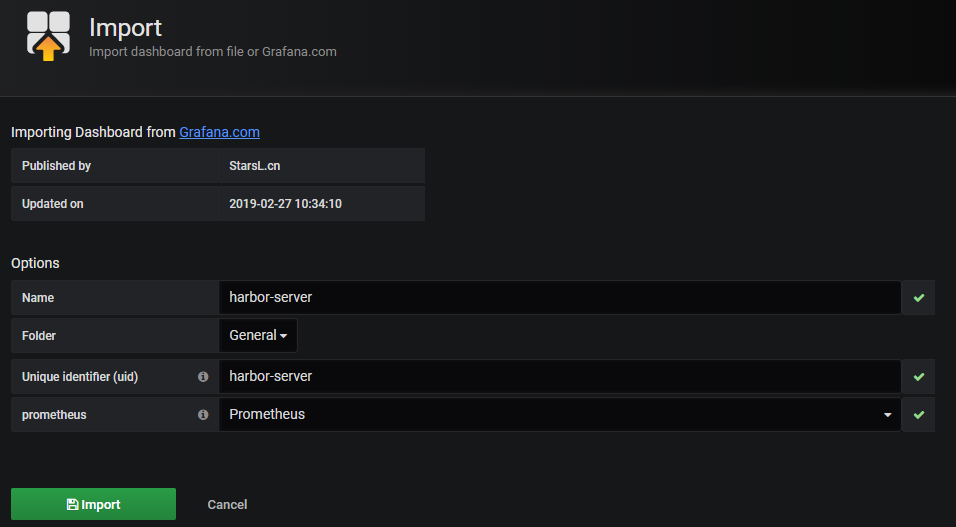
点击‘ + ’ 选择Import 输入模板ID 8919
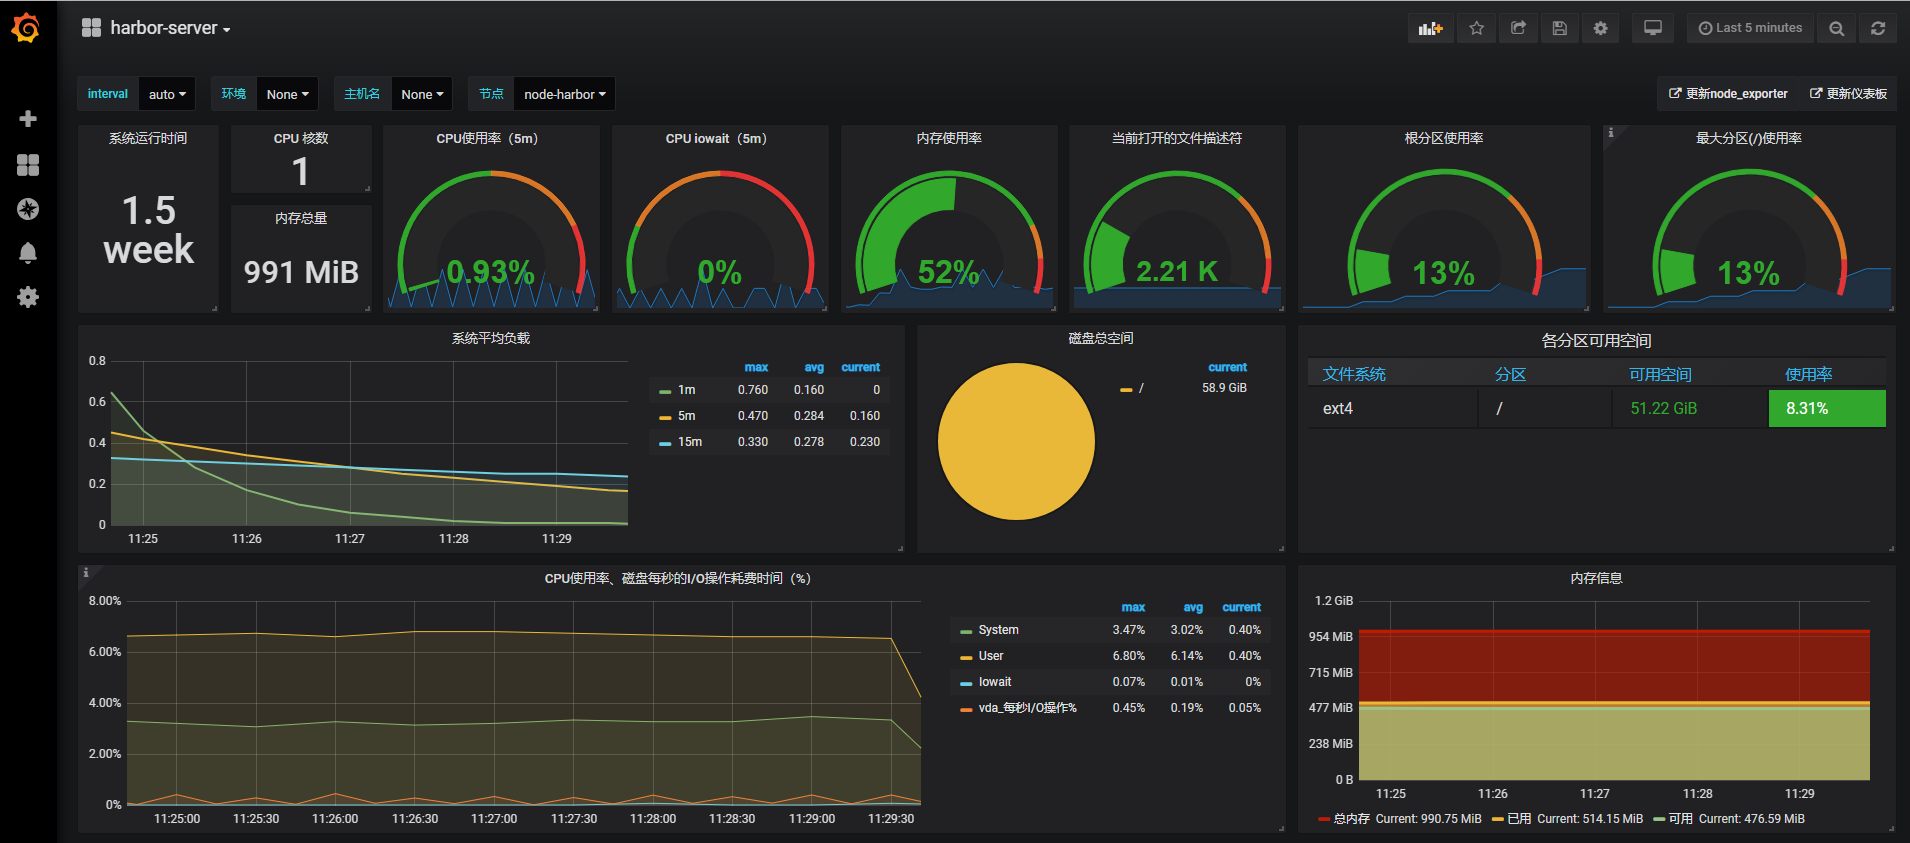
设置模板名称,uid 数据源 保存即可看到监控页面
注意 如果你是新的server会发现饼状图的数据加载不出,这个说明的是饼状图插件没有安装
6 安装饼状图插件
grafana-cli plugins install grafana-piechart-panel
systemctl  restart grafana-server
安装mysql作为grafana 源
1 添加源
rpm -Uvh http://dev.mysql.com/get/mysql-community-release-el7-5.noarch.rpm

yum repolist enabled | grep "mysql.*-community.*"
2 安装 mysql-5.6
yum -y install mysql-community-server3 启动mysql并简单安全设置
systemctl enable mysqld
systemctl start mysqld
systemctl status mysqld

mysql_secure_installation 设置密码一路Y
4 创建grafana 数据库
create database grafana;
create user grafana@'%' IDENTIFIED by 'grafana';
grant all on grafana.* to grafana@'%';
flush privileges;
5 修改配置文件连接mysql
vim /etc/grafana/grafana.ini

[database]
type = mysql
host = 127.0.0.1:3306
name = grafana
user = grafana
password =grafana
url = mysql://grafana:grafana@localhost:3306/grafana

[session]
provider = mysql
provider_config = `grafana:grafana@tcp(127.0.0.1:3306)/grafana`


systemctl restart grafana-server
6 重复grafana安装配置即可
HAproxy指标导出器的安装
1 进入opt目录下载HAproxy节点指标导出器:
wget https://github.com/prometheus/haproxy_exporter/releases/download/v0.9.0/haproxy_exporter-0.9.0.linux-amd64.tar.gz2 解压HAproxy节点指标导出器并删除压缩包:
tar -xvf haproxy_exporter-0.9.0.linux-amd64.tar.gz && rm haproxy_exporter-0.9.0.linux-amd64.tar.gz3 修改文件夹名称
mv haproxy_exporter-0.9.0.linux-amd64/ haproxy_exporter4 追加HAproxy配置文件:
cat << EOF >> /etc/haproxy/haproxy.cfg
listen stats
        mode http
        bind 0.0.0.0:5000
        stats enable
        stats hide-version
        stats uri /stats
        stats realm Haproxy\ Statistics
        stats auth admin:admin123
        stats admin if TRUE #启用管理功能
EOF
5 重启HAproxy:
/etc/init.d/haproxy reload6 进入对应文件夹后后台运行导出器程序:
nohup ./haproxy_exporter --haproxy.scrape-uri="http://admin:admin123@localhost:5000/stats;csv" 2>&1 &7 查看9100端口是否正常运行:
netstat -lntpWindows节点指标导出器的安装
1 下载Windows节点指标导出器:
https://github.com/martinlindhe/wmi_exporter/releases/download/v0.5.0/wmi_exporter-0.5.0-amd64.msi2 打开Prowershell执行一下命令,注意程序所在路径是否正确
msiexec /i C:\Users\Administrator\Downloads\wmi_exporter-0.5.0-amd64.msi ENABLED_COLLECTORS=iis,os,cpu,cs,memory,mssql,netframework_clrjit,netframework_clrinterop,netframework_clrexceptions,netframework_clrloading,netframework_clrlocksandthreads,netframework_clrmemory,net,service,system,tcp,textfile LISTEN_PORT=9182配置grafana + Telegram 告警
1.对接Telegram官方接口@BotFather

2.输入/newbot命令创建你自己的机器人
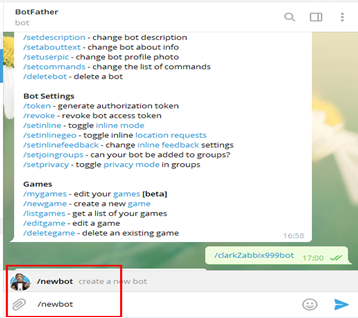
3.然后根据提示输入机器人的名称和用户名,用户名必须以bot结尾

4.这样机器人就创建完成了,返回信息当中的token必须保存好备用
Done! Congratulations on your new bot. You will find it at t.me/zabbix999190411bot. You can now add a description, about section and profile picture for your bot, see /help for a list of commands. By the way, when you've finished creating your cool bot, ping our Bot Support if you want a better username for it. Just make sure the bot is fully operational before you do this.

Use this token to access the HTTP API:
892821041:AAH9CPY5Ml-pybYgfd-cR-Vo1FZoual3cNE
Keep your token secure and store it safely, it can be used by anyone to control your bot.

For a description of the Bot API, see this page: https://core.telegram.org/bots/api
5.接下来使用API/bottoken/API方法getMe获取自己的id
root@alex prometheus-2.8.1.linux-amd64]# curl https://api.telegram.org/bot892821041:AAH9CPY5Ml-pybYgfd-cR-Vo1FZoual3cNE/getMe
{"ok":true,"result":{"id":892821041,"is_bot":true,"first_name":"zabbix999190411bot","username":"zabbix999190411bot"}}
![]()
6.获取群ID
在Telegram新建group,然后添加成员刚创建的机器人,调用API方法getUPdates获取群ID
https://api.telegram.org/bot892821041:AAH9CPY5Ml-pybYgfd-cR-Vo1FZoual3cNE/getUpdates
{"ok":true,"result":[{"update_id":434572998,
"message":{"message_id":5,"from":{"id":787933444,"is_bot":false,"first_name":"Alex","last_name":"Liu","language_code":"zh-hans"},"chat":{"id":-234667255,
"title":"ZABBIX999","type":"group","all_members_are_administrators":true},"date":1554977987,"text":"/getMe","entities":[{"offset":0,"length":6,"type":"bot_command"}]}}]}
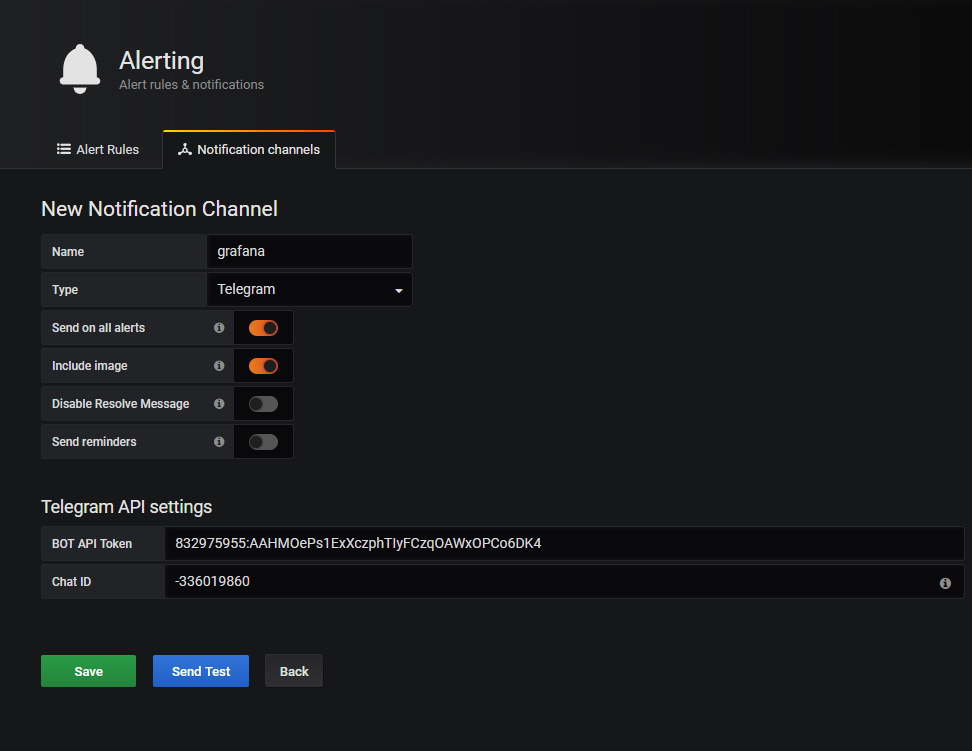
7 配置 grafana Alerting
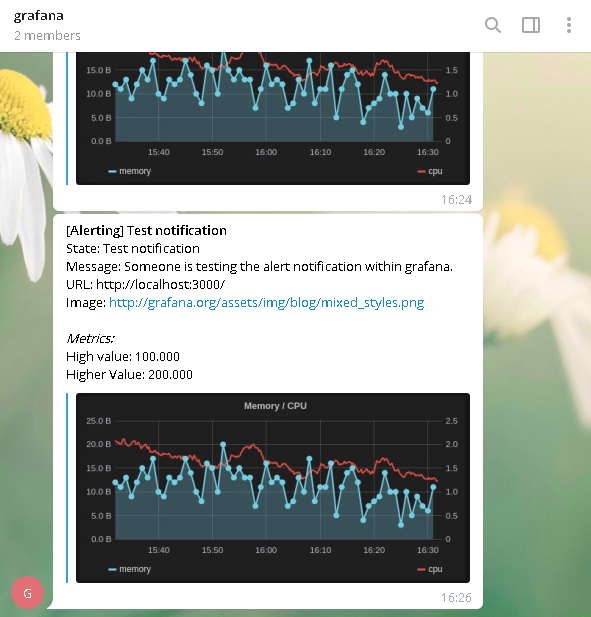
配置完成后 点击send test 测试
收到的测试告警
如果使用微信配置是相同的,只需要获取企业账号的相关ID即可
8 测试服务器报警
测试服务器告警以真实服务器为例,测试内存数据告警
查看正式服务器内存
[root@lb-1 ~]# free -m
              total        used        free      shared  buff/cache   available
Mem:           1839         176        1382           8         281        1494
Swap:          2047           0        2047
添加魔板 8919 这里的配置不做赘述以上面已经讲过
接下来修改模板添加告警json,打开模板设置修改 json
修改json增加告警需要增加段json 块,必须要注意的是配置wean告警必须要替换里面的变量 $node 为prometheus里面配置文件相应的instance标签的名字否则不能告警.
{
  "annotations": {
    "list": [
      {
        "builtIn": 1,
        "datasource": "-- Grafana --",
        "enable": true,
        "hide": true,
        "iconColor": "rgba(0, 211, 255, 1)",
        "name": "Annotations & Alerts",
        "type": "dashboard"
      }
    ]
  },
  "description": "使用 Node Exporter v0.16 0.17,精简优化重要指标展示。包含:CPU 内存 磁盘 IO 网络 温度等监控指标。https://github.com/starsliao/Prometheus",
  "editable": true,
  "gnetId": 8919,
  "graphTooltip": 0,
  "id": 11,
  "iteration": 1555301097807,
  "links": [
    {
      "icon": "external link",
      "tags": [],
      "targetBlank": true,
      "title": "更新node_exporter",
      "tooltip": "",
      "type": "link",
      "url": "https://github.com/prometheus/node_exporter/releases"
    },
    {
      "icon": "external link",
      "tags": [],
      "targetBlank": true,
      "title": "更新仪表板",
      "tooltip": "",
      "type": "link",
      "url": "https://grafana.com/dashboards/8919"
    }
  ],
  "panels": [
    {
      "content": "",
      "editable": true,
      "error": false,
      "gridPos": {
        "h": 1,
        "w": 24,
        "x": 0,
        "y": 0
      },
      "id": 11,
      "links": [],
      "maxPerRow": 6,
      "mode": "html",
      "repeat": "node",
      "repeatDirection": "h",
      "scopedVars": {
        "node": {
          "selected": true,
          "text": "nginxvlb",
          "value": "nginxvlb"
        }
      },
      "style": {},
      "title": "nginxvlb",
      "type": "text"
    },
    {
      "cacheTimeout": null,
      "colorBackground": false,
      "colorValue": false,
      "colors": [
        "rgba(245, 54, 54, 0.9)",
        "rgba(237, 129, 40, 0.89)",
        "rgba(50, 172, 45, 0.97)"
      ],
      "datasource": "Prometheus",
      "decimals": 1,
      "description": "",
      "format": "s",
      "gauge": {
        "maxValue": 100,
        "minValue": 0,
        "show": false,
        "thresholdLabels": false,
        "thresholdMarkers": true
      },
      "gridPos": {
        "h": 5,
        "w": 2,
        "x": 0,
        "y": 1
      },
      "hideTimeOverride": true,
      "id": 15,
      "interval": null,
      "links": [],
      "mappingType": 1,
      "mappingTypes": [
        {
          "name": "value to text",
          "value": 1
        },
        {
          "name": "range to text",
          "value": 2
        }
      ],
      "maxDataPoints": 100,
      "nullPointMode": "null",
      "nullText": null,
      "postfix": "",
      "postfixFontSize": "50%",
      "prefix": "",
      "prefixFontSize": "50%",
      "rangeMaps": [
        {
          "from": "null",
          "text": "N/A",
          "to": "null"
        }
      ],
      "sparkline": {
        "fillColor": "rgba(31, 118, 189, 0.18)",
        "full": false,
        "lineColor": "rgb(31, 120, 193)",
        "show": false
      },
      "tableColumn": "",
      "targets": [
        {
          "expr": "time() - node_boot_time_seconds{instance=~\"nginxvlb\"}",
          "format": "time_series",
          "hide": false,
          "instant": true,
          "intervalFactor": 2,
          "refId": "A",
          "step": 40
        }
      ],
      "thresholds": "",
      "title": "系统运行时间",
      "type": "singlestat",
      "valueFontSize": "100%",
      "valueMaps": [
        {
          "op": "=",
          "text": "N/A",
          "value": "null"
        }
      ],
      "valueName": "current"
    },
    {
      "cacheTimeout": null,
      "colorBackground": false,
      "colorValue": false,
      "colors": [
        "rgba(245, 54, 54, 0.9)",
        "rgba(237, 129, 40, 0.89)",
        "rgba(50, 172, 45, 0.97)"
      ],
      "datasource": "Prometheus",
      "description": "",
      "format": "short",
      "gauge": {
        "maxValue": 100,
        "minValue": 0,
        "show": false,
        "thresholdLabels": false,
        "thresholdMarkers": true
      },
      "gridPos": {
        "h": 2,
        "w": 2,
        "x": 2,
        "y": 1
      },
      "id": 14,
      "interval": null,
      "links": [],
      "mappingType": 1,
      "mappingTypes": [
        {
          "name": "value to text",
          "value": 1
        },
        {
 最低0.47元/天 解锁文章


 652
652


 被折叠的 条评论
为什么被折叠?
被折叠的 条评论
为什么被折叠?
 到【灌水乐园】发言


