


一、相关概念
Cacti定义了三种类型的模板,分别是
主机模板
数据模板
图形模板
主机模板(Host templates),它是图形模板和数据查询的一个集合(Associated Graph Templates + Associated Data Queries),描述了监控某一类型的机器需要监控的项目与如何生成图形。
数据模板(Data templates),它定义了 怎么通过数据收集方法接收数据,数据源中的数据如何进行保存,以及保存在什么地方。创建并更新 RRD 文件,该模板与 RRDTool 工具的 rrdtool create ; rrdtool update 命令相关。
图形模板(Graph templates),描述了如何进行绘图,生成的一张图像应该是什么样子的。包括使用哪些数据模板、展示哪些元素、是否使用 CDEF 进行计算汇总。该模板使用 rrdtool graph 命令。

模板关系说明
【Graph Templates】和【Data Template】存在对应关系。当添加完监控设备后,设备绑定的【Graph Templates】会根据文件名自动去掉主机名称寻找对应名称的【Data Template】。如生成图象[××× Ser ver - ApacheStats08 - Total Hits]就会寻找[ApacheStats08 - Total Hits]数据模板。这里需要特别说明的是,如果监控设备所使用的【Host Templates】创建时有添加任意一个【Data Queries】的话,那最后生成图象的数量可能会有多个,其对应的数据模板依据【Data Queries】配置中的[XML Path]文件。
同时也定义数据收集方法,分别是:
Data Queries
Data Input Methods
数据输入方法(Data input methods),数据模板基于数据输入方法,数据输入方法描述了 Cacti 获取监控数据的各种方法。其中最常用的就是 SNMP,但这里我们要用到一些自定义的模板。
数据查询(Data queries),它是一种特殊的获取监控数据的方式,它所获取的监控数据一般是某一方面的一系列数据,比如网络接口信息。一般包括一个 XML 文件,其中定义了要获取的数据,以及获取方法(一般是一个命令或脚本)。
二、Cacti 模板
Cacti进行监控很大一部分都是使用模板的形式完成的,而Cacti在安装完成之后,其本身自带了一部分模板,这些模板虽然可用,但是支持的监控项目太少,于是我们要寻求更多模板以及更优化的内容。
在实际的工作工程中,我们可能需要监控更多的指标。此时该怎么办呢?其实cacti官方提供了许多模板,而且很多志愿者也提供了大量的模板,我们可以直接下载,解压缩,然后导入模板,直接使用。
Cacti 的官方模板库: http://docs.cacti.net/templates
cacti官方网站 -> forums -> Scripts and Templates, 这里的模板应有尽有,基本能够满足我们的监控需求。

1、Cacti 模板一般加载方法
一个Cacti的模板一般有两部分组成。一部分是xml模板文件,另一部分是xml的数据收集文件,虽然这两种文件都是xml格式的,但是你可以很显而易见的就能分出它们的不同。因为它们的文件大小一点都不相似。

a、xml 模板文件要在 Cacti 的web 页面 Console 选项卡 Import Templates 项进行添加:

b、而xml数据收集文件,则是要放在 Cacti 部署目录的 cacti/resource/snmp_queries 目录下:

只要将两种类型的xml正确的导入/放入到应有的位置,那么模板就添加成功了。
1、【Data Queries】由【Data Input Methods】组成创建, 通常表现为 XML 格式的文件,并在其[Associated Graph Templates]指向所支持的【Graph Templates】;

2、【Host Templates】由【Graph Templates】组成创建,也可同时在[Associated Data Queries]绑定【Data Queries】;【Graph Templates】和【Data Template】存在对应关系。
3、【Devices】在添加时绑定【Host Templates】后,其[Associated Graph Templates]处于“Not Being Graphed”状态,点击右上方的[Create Graphs for this Host]进入到界面全选中后启动绘画,状态变更为“Is Being Graphed”开始生效;
4、【Devices】生成画象后,点击[Data Source List]看到【Data Source】,每行【Data Source】记录对应一个【Data Template】以及【Data Template】实例化后的[Supplemental Data Template Data]RRD文件。
下面我们就来看一看如何使用模板?
添加主机模板(Linux / Windows 类似),并添加新主机进行监控
首先,基本上我们使用的所有模板都可以到官方的站点上下载到:
http://forums.cacti.net/viewforum.php?f=12&sid=fe2532345bf037678cb1e9fb07b40f16
http://docs.cacti.net/templates
当我们下载某个模板的时候,请一定要仔细的阅读其 Installation(相当重要),可以避免很多不必要的错误。举个例子,比如我要下载cacti087e_linux_generic-20100519-yrg.zip, 然后,其作者给出了详细的安装说明:
Installation
Unzip the download
Via cacti web console, click on “Import Templates” and import the file “cacti_host_template_*.xml”
Create new device using the new imported host template
Check new graphs
OK, 我们演示一下,如果添加并使用模板。
a. 在Cacti的Web页面Console->Import Templates导入响应的xml模板文件。
b. 在Linux上cacti/resource/snmp_queries中放入模板相关的xml数据收集文件。并确保属主和属组均为cacti。
c. 点击Console->Devices,打开设备管理页面。
d. 点击右上角的add,添加一个新的机器
1、添加模板
Import Templates -> 浏览 -> Import, 然后就OK了。

2、使用模板
添加设备:Devices -> Add , 然后主要编辑两个地方
General Host Options
SNMP Options


e. 当主机信息填好之后, 点击 Create 。
f. 此时你的页面左上角应该显示: Save Success,并且显示出了主机信息和SNMP信息,如果显示 SNMP error, 则要检查被监控机的snmp状态。
g. 这时我们就可以添加相应的监控项了,在页面最下方的Associated Graph Templates中添加图形模板,在Associated Data Queries中添加数据模板。
h. 添加好相应的模板之后点击Save。此时左上角会出现Save Successful.
i. 点击右上角的Create Graphs for this Host,来为刚才通过模板所获得到的数据进行画图。
j. 选中需要画图的项,其中依然分为两部分:
通过Graph Templates中的内容都需要选中,而Data Query获取的内容比较详细,所以可以按需选择。
k. 选择好需要画图的项目后,点击右下角的Create,左上角会出现被创建出来的画图项。
为主机创建图形

然后勾选,需要创建哪些图形:

然后,再把此设备添加到Graph Trees, 方便管理
2.在Graphs Trees 中新添加主机。
a. 在Cacti Web界面Graph Trees中,选择相应的列(或者系统默认的Default Tree)。
b. 进去Tree之后,点击右上角的Add,添加一个新的显示项。
c. 在Tree Item Type中选择Host,然后在下面的Host中选择我们刚才创建的主机。点击Create。
d. 此时,再进入Graphs界面,就可以看到在Default Tree下加入了我们新创建的主机。
Graph Trees -> 选择一个Tree Name -> Add -> Tree Item Type(Host) -> Create

就这么简单,那么等一会儿就会出图了。
添加图形模板
导入方式和主机模板的导入方式相同。导入后,可以在console -> templates -> Graph Templates中查看。
我们以添加cacti_graph_template_linux_server_-_processes.xml.gz 为例,演示一下,如何添加并使用图形模板。下载,并查看其Installation.
Installation
unzip the file
$ gzip -d cacti_graph_template_linux_server_-_processes.xml.gz
use Console-> Import/Export -> Import Templates to import the XML file
这里,导入的过程就不截图演示了, 和上面导入主机模板的步骤一样。
如何把添加的图形模板,应用到特定的主机上呢?
Graph Management -> Host标签选择一个主机 -> Add -> Selected Graph Template -> Create

如何把主机上添加的图形模板删除呢?
Graph Management -> 选择主机 -> 选择 -> 然后 choose an action: Delete

在下一步,我们选择第一个选项,保留数据源,只删除图形模板。

cacti之自定义监控脚本
如果在cacti官方论坛上,找不到合适的模板,这该如何是好? 此时可能就需要我们自定义了。
在前面的文章中,已经提到。cacti数据收集方法主要有两类:
Data Queries 主要是定义好的xml文件
Data Input Methods 主要是 scripts, command (最常用)
cacti自定义监控脚本进行监控的具体流程如下:
自定义数据收集方法,脚本(xml, scripts, command)
数据收集了如何保存呢?数据模板。数据模板定义了:怎么通过数据收集方法获取数据,获取的数据如何保存,以及保存在什么地方。(也就是定义如何创建 rrd 文件)
把数据模板应用到特定的device上,就会创建数据源。(也就是调用rrdtool create , rrdtool update)
有了数据源,那么就可以绘图了。图形模板或者自定义,应用到相应的数据源上。(rrdtool graph)
以下是cacti官方文档:
http://docs.cacti.net/manual:087:3a_advanced_topics.1_data_input_methods
任何可以通过脚本来获取数据的设备都可以使用cacti来监控。
步骤一: Creating a Data Input Method
To create a new data input method, select the Data Input Methods option under the Management heading. Once on that screen, click Add on the right. You will be presented with a few fields to populate on the following screen.

When you are finished filling in all necessary fields, click the Create button to continue.You will be redirected back to the same page, but this time with two new boxes,Input Fields and Output Fields. The Input Fields box is used to define any fields that require information from the user. Any input fields referenced to in the input string must be defined here. The Output Fields box is used to define each field that you expect back from the script. All data input methods must have at least one output field defined, but may have more for a script.
Data Input Fields
To define a new field, click Add next to the input or output field boxes. You will be presented with some or all of the fields below depending on whether you are adding an input or output field.

When you are finished filling in all necessary fields, click the Create button to continue.You will be redirected back to the data input method edit page. From here you can continue to add additional fields, or click Save on this screen whenfinished.
步骤二: Making Your Scripts Work With Cacti
The simplest way to extend Cacti's data gathering functionality is through external scripts.Cacti comes with a number of scripts out of the box which are located in the scripts/ directory. These scripts are used by the data input methods that are present in a new installation of Cacti.
To have Cacti call an external script to gather data you must create a new data input method,making sure to specify Script/Command for the Input Type field. See the previous section, Creating a Data Input Method for more information about how to create a data input method. To gather data using your data input method, Cacti simply executes the shell command specified in the Input String field. Because of this, you can have Cacti run any shell command or call any script which can be written in almost any language.
What Cacti is concerned with is the output of the script. When you define your data input method, you are required to define one or more output fields. The number of output fields that you define here is important to your script\'s output.
Data input methods with more than one output field are handled a bit differently when writing scripts. Scripts that output more than one value should be formatted like the following:
<fieldname_1>:<value_1>   <fieldname_2>:<value_2> ... <fieldname_n>:<value_n>

## Example script output using 3 fields
1min:0.40   5min:0.32   10min:0.01
Note: Spine requires, that multiple parameters are spit out by a single “print” statement. Do not printthem in a loop!
下面就来演示一下,进行自定义监控的整个流程。
回忆通过rrdtool 画图的步骤:
1、编写脚本,获取数据
2、周期性执行上述脚本获取数据
3、rrdtool create 创建数据源,并且通过 rrdtool update 更新数据
4、然后通过 rrdtool graph 进行绘图
步骤一、创建 Data Input Method , 搜集数据
[root@bogon ~]# vi tcpconn.sh
#!/bin/bash

# $1: hostname or ip
# $2: snmp community

if [[ $# -ne 2 ]];then
	echo "Usage: $0 [hostname | IP]  snmp_community"
	exit
fi

SNMPNETSTAT=/usr/bin/snmpnetstat
ESTABLISHED=$(${SNMPNETSTAT} -v2c -c $2 -Can -Cp tcp $1 | grep -i 'established' | wc -l)

echo -n "established:$ESTABLISHED"


## 为脚本添加可执行权限
# chmod +x tcpconn.sh

## 把脚本复制到cacti安装目录的scripts目录下(重要)   <path_cacti>
# cp tcpconn.sh /web/cacti/scripts/
注意:
数据收集方法的输出格式比较特殊,而且规定必须按照这样的输出格式才行。
必须定义的数据输入方法的脚本 放到cacti <path_cacti> 安装目录下的 scripts 目录下,并赋予可执行权限
官方文档这样描述: Data inputmethods with more than one output field are handled a bit differently whenwriting scripts. Scripts that output more than one value should be formattedlike the following:
<fieldname_1>:<value_1> <fieldname_2>:<value_2> ... <fieldname_n>:<value_n>
步骤二、在Cacti 上添加数据输入方法(把数据输入方法附加到cacti,通过cacti来周期性的调用它)
【Data Input Methods】 - 【Add】

接下来你应该看到如下,填入相应的信息。
Please fill in Name, select Script/Command as Input Type and provide the command that should be used to retrieve the data. You may use <path_cacti> as a symbolical name for the path_to_your_cacti_installation. Those commands will be executed from crontab; so pay attention to providing full path to binaries if required (e.g./usr/bin/perl instead of perl). Enter all Input Parameters in <> brackets.

怎么执行我们的脚本呢?
/bin/bash。
脚本的具体路径呢?
可以引用<path_cacti>, cacti 预先定义好的宏。
我们的脚本需要传递参数,该如何传递呢?
<path_cacti>是一个宏,引用cacti的安装目录
如果脚本需要接受参数,请用<>括起来
然后点击"Create",你可以看到如下界面。下面的Input Fields, Output Fields,分别对应参数输入以及脚本的输出。

有几个Input Fields就需要Add几次,同样有多少个Output Fields也需要Add多少次。
添加Input Fields】

我们看到,cacti已经定义了许多 Speial Type Code。它们类似于宏,我们能够继承它并能够取得相应device相关的信息。我们知道图形和数据收集方法都必须关联到特定的device上,在定义device时,就会指定其hostname等相关信息。如果我们没有提供输入的参数,就让它自动去继承device的那些宏。如果使用hostname,那么此脚本应用到哪个设备上,就会获得那个设备的hostname。如果snmp_community,那么就会自动引用我们在添加设备时,指定的那个community。
比如,我在定义device时,填入的信息如下

那么,此时的Special Type Code: hostname==127.0.0.1, snmp_community==public
【添加Output Fields】

注意,当我们接收到一个数据之后,就需要更新RRD文件,所以"Update RRD File"这里必须勾选。
3、定义数据模板(定义如何存储,如何创建 rrd 文件)
上一步中,我们定义了数据收集方法并应用到cacti上,那么收集到的数据如何保存呢?保存在什么地方?如何创建rrd文件? 这些都是数据模板完成的,所以接下来我们要定义数据模板。

然后,下面的定义,我们可以参考其他的数据模板进行填写,如果不知道该怎么填,不妨先看看其他的数据模板是如何定义的。
我们看到Name这里比较特殊 "|host_description|", 这样能自动获取device的Description。 以及"Internal Data Source Name",数据源的名称,注意其命名规则,a_zA_Z0-9_,并且不超过19个字符。

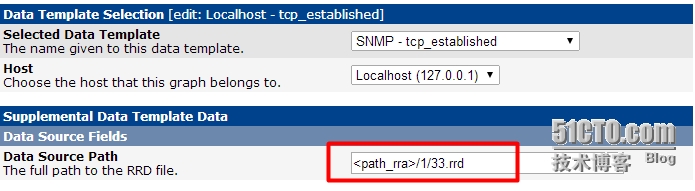
4、当我们把数据模板应用到某个device上时,就创建数据源(Data Sources)
此时完成: rrdtool create , rrdtool update
注意,数据源一定是关联到某个device上的。我们必须指定Host,然后再Add

然后选择对应的数据模板(刚才我们添加的)和需要关联的主机。

此步骤完成后,就会创建相应的rrd文件了。

当然,这里的"Data Source Path"可以根据自己需要命名。然后稍等片刻,就会在/web/cacti/rra目录下创建rrd文件。
5、添加图形模板(定义如何绘图)
图形模板,也可以参考其他的模板进行填写

填写一些关于图形的基本信息(name, title),其他保持默认或者根据自己需要填写。点击"创建"之后,我们还需要更详细的设置。

"Graph Item"是什么? 图形项,相当于图形上的线条、区域块、注释等等元素。每一个Item表示一个元素。

然后Add "Graph Item Inputs"

6、把图形模板关联到device (执行 rrdtool graph)
console -> Graph Management -> 指定Host -> Add

好了,终于搞定了。
如果想要显示下面这种效果,该怎么做?

重新编辑我们的graph templates, 点击我们需要更改的模板名称:

在下面的设置中,"Graph Item Type"选择 GPRINT。

OK,就先说到这里,更多更高级的功能,还希望大家去挖掘。
我们在操作的过程中,其实思路是比较清晰的,但是面对众多的选项,却不知道如何是好,如果你了解rrdtool,这些都不是事儿,如果不了解,可能看起来就相当痛苦,因为你不知道具体在做什么?万丈高楼平地起,所以我还是建议各位去看看rrdtool是如何工作的。
http://blog.sina.com.cn/s/blog_6e88948f01014ze7.html
转载于:https://blog.51cto.com/skypegnu1/1547029


 682
682

 被折叠的 条评论
为什么被折叠?
被折叠的 条评论
为什么被折叠?
 到【灌水乐园】发言


