1.max
统计最大年龄
GET my_person/_search
{
  "size": 0,
  "aggs": {
    "age_max": {
      "max": {
        "field": "age"
      }
    }
  }
}
结果
{
  "took": 6,
  "timed_out": false,
  "_shards": {
    "total": 5,
    "successful": 5,
    "skipped": 0,
    "failed": 0
  },
  "hits": {
    "total": 4,
    "max_score": 0,
    "hits": []
  },
  "aggregations": {
    "age_max": {
      "value": 28
    }
  }
}
2.min
统计最小年龄
GET my_person/_search
{
  "size": 0,
  "aggs": {
    "age_min": {
      "min": {
        "field": "age"
      }
    }
  }
}
3.avg
统计平均年龄
GET my_person/_search
{
  "size": 0,
  "aggs": {
    "age_avg": {
      "avg": {
        "field": "age"
      }
    }
  }
}
4.sum
求和
GET my_person/_search
{
  "size": 0,
  "aggs": {
    "salary_sum": {
      "sum": {
        "field": "salary"
      }
    }
  }
}
5.stats
The stats that are returned consist of: min, max, sum, count and avg.
GET my_person/_search
{
  "size": 0,
  "aggs": {
    "salary_stats": {
      "stats": {
        "field": "salary"
      }
    }
  }
}
结果
{
  "took": 12,
  "timed_out": false,
  "_shards": {
    "total": 5,
    "successful": 5,
    "skipped": 0,
    "failed": 0
  },
  "hits": {
    "total": 4,
    "max_score": 0,
    "hits": []
  },
  "aggregations": {
    "salary_stats": {
      "count": 4,
      "min": 4000,
      "max": 8000,
      "avg": 5750,
      "sum": 23000
    }
  }
}
6.extended_stats
相比于stats新增了几个统计属性
GET my_person/_search
{
  "size": 0,
  "aggs": {
    "salary_stats": {
      "extended_stats": {
        "field": "salary"
      }
    }
  }
}
查询结果
{
  "took": 13,
  "timed_out": false,
  "_shards": {
    "total": 5,
    "successful": 5,
    "skipped": 0,
    "failed": 0
  },
  "hits": {
    "total": 4,
    "max_score": 0,
    "hits": []
  },
  "aggregations": {
    "salary_stats": {
      "count": 4,
      "min": 4000,
      "max": 8000,
      "avg": 5750,
      "sum": 23000,
      "sum_of_squares": 141000000,
      "variance": 2187500,
      "std_deviation": 1479.019945774904,
      "std_deviation_bounds": {
        "upper": 8708.039891549808,
        "lower": 2791.960108450192
      }
    }
  }
}
7.基数统计
查询薪资分为几个等级
GET my_person/_search
{
  "size": 0,
  "aggs": {
    "salary_class": {
      "cardinality": {
        "field": "salary"
      }
    }
  }
}
查询结果
{
  "took": 9,
  "timed_out": false,
  "_shards": {
    "total": 5,
    "successful": 5,
    "skipped": 0,
    "failed": 0
  },
  "hits": {
    "total": 4,
    "max_score": 0,
    "hits": []
  },
  "aggregations": {
    "salary_class": {
      "value": 4
    }
  }
}
8.文档数量统计
统计包含某一字段的文档数量
添加两个文档
PUT my_person/my_index/5
{
  "name":"lucy",
  "age":23
}

PUT my_person/my_index/6
{
  "name":"blue",
  "age":20
}
查询所有文档中包含”salary“文档数量
GET my_person/_search
{
  "size": 0,
  "aggs": {
    "doc_count": {
      "value_count": {
        "field": "salary"
      }
    }
  }
}
查询结果
{
  "took": 9,
  "timed_out": false,
  "_shards": {
    "total": 5,
    "successful": 5,
    "skipped": 0,
    "failed": 0
  },
  "hits": {
    "total": 6,
    "max_score": 0,
    "hits": []
  },
  "aggregations": {
    "doc_count": {
      "value": 4
    }
  }
}
9.百分位计算
https://www.elastic.co/guide/cn/elasticsearch/guide/current/percentiles.html
Elasticsearch 提供的另外一个近似度量就是 percentiles 百分位数度量。 百分位数展现某以具体百分比下观察到的数值。例如,第95个百分位上的数值,是高于 95% 的数据总和。
百分位数通常用来找出异常。在(统计学)的正态分布下,第 0.13 和 第 99.87 的百分位数代表与均值距离三倍标准差的值。任何处于三倍标准差之外的数据通常被认为是不寻常的,因为它与平均值相差太大。
假设我们正运行一个庞大的网站,一个很重要的工作是保证用户请求能得到快速响应,因此我们就需要监控网站的延时来判断响应是否能保证良好的用户体验。
在此场景下,一个常用的度量方法就是平均响应延时。 但这并不是一个好的选择(尽管很常用),因为平均数通常会隐藏那些异常值, 中位数有着同样的问题。 我们可以尝试最大值,但这个度量会轻而易举的被单个异常值破坏。
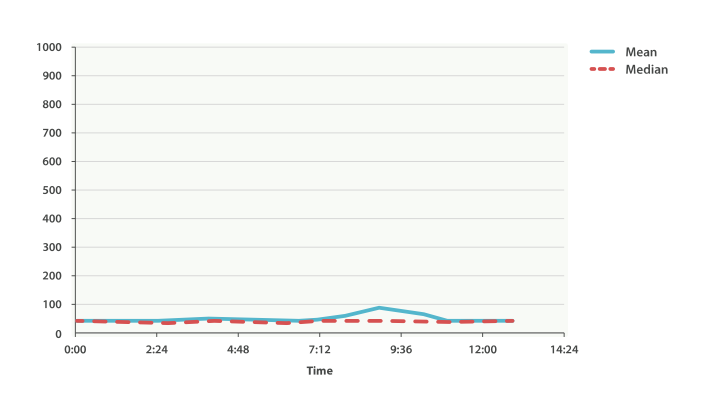
依靠如平均值或中位数这样的简单度量

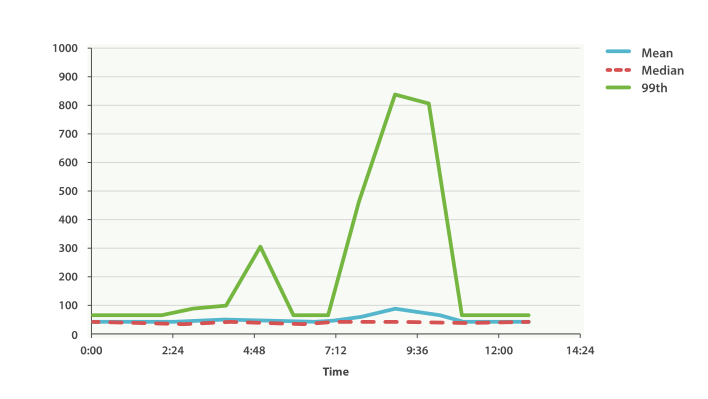
加载 99 百分位数时

人吃惊!在上午九点半时,均值只有 75ms。如果作为一个系统管理员,我们都不会看他第二眼。 一切正常!但 99 百分位告诉我们有 1% 的用户碰到的延时超过 850ms,这是另外一幅场景。 在上午4点48时也有一个小波动,这甚至无法从平均值和中位数曲线上观察到。


 被折叠的 条评论
为什么被折叠?


