


I need to draw some curves in Python3 (I am quite used to matplotlib.pyplot) but I have never drawn such things before and I would really appreciate some tips (especially tips how to code it in a "tidy" way) and help.
There is an example (let's use a heart!):
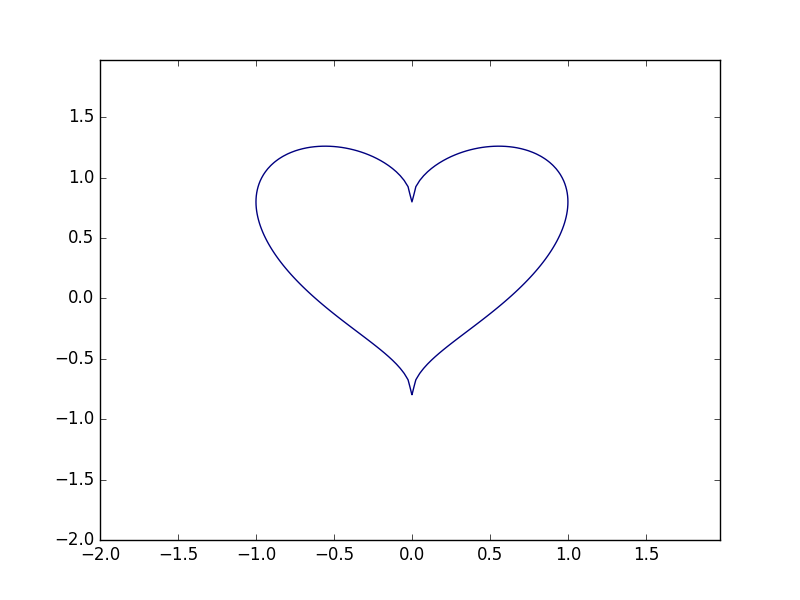
x^2+(5y/4-sqrt[|x|])^2=1
How can I code such a thing? Should I cut that formula into normal areas and then draw them?
解决方案
According to the equation you show you want to plot an implicit function, you should use contour considering F = x^2 and G = 1-(5y/4-sqrt[|x|])^2, then F-G = 0
import matplotlib.pyplot as plt
import numpy as np
delta = 0.025
xrange = np.arange(-2, 2, delta)
yrange = np.arange(-2, 2, delta)
X, Y = np.meshgrid(xrange,yrange)
# F is one side of the equation, G is the other
F = X**2
G = 1- (5*Y/4 - np.sqrt(np.abs(X)))**2
plt.contour((F - G), [0])
plt.show()
Output:


 1128
1128


 被折叠的 条评论
为什么被折叠?
被折叠的 条评论
为什么被折叠?
 到【灌水乐园】发言


