


 本文概述了AP统计学考试中的关键知识点,包括数据类型、图形表示如直方图、箱线图等,以及如何通过图形分析数据的分布特征,如对称性、偏态和集中趋势。还提到了概率密度函数和累积分布函数在描述数据分布中的作用,并介绍了数字特征如集中趋势和离散趋势的度量。此外,标准化变量(z-score)也被提及,它是理解数据标准化的重要工具。文章旨在帮助考生更好地理解和准备AP统计考试。
AP统计知识点庞杂、公式繁多,这里给大家做了考前梳理,这么强的助攻贴也是没sei啦,预祝各位小主儿考出新高度
一、描述统计
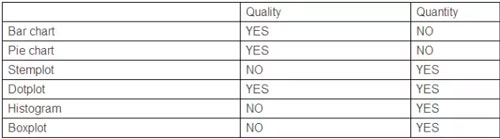
* 数据(data)分为定性数据(qualitative or categorical data)与定量数据(quantitativedate)。
定性数据:按照类别进行划分,展示对象的属性;
定量数据:展示对象的数值特征。
* 图(graph):分为bar chart, pie chart, dotplot, stemplot, histogram, boxplot
* 通过图形可以看出数据的分布特征:
(1)对称(symmetric)
(2)偏态(skewed)
左偏(skewed to the left)
右偏(skewed to the right)
(3)集中趋势
(4)异常值
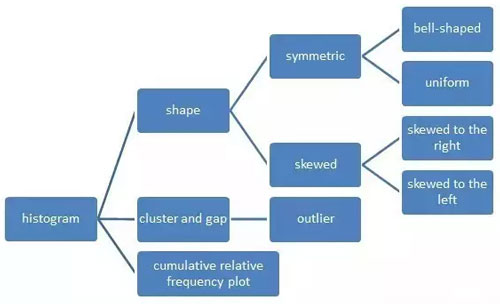
* histogram的画法:
(1)以个数作为高度
(2)以百分比作为高度
(3)以百分比作为面积。
* 概率密度(probability density function, pdf)
描绘以百分比作为面积的histogram的曲线。
* 累积分布(cumulative distribution function, cdf)
以小于等于该数的数据所占百分比作为该数的纵坐标绘制出的曲线。
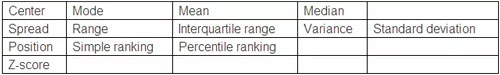
* 数字特征(numerical value)
(1)描述集中趋势
(2)描述离散趋势
(3)描述位置
(4)标准化变量(z-score)
本文关键字:AP统计公式,考点整理
编辑: alex


 1189
1189

 被折叠的 条评论
为什么被折叠?
被折叠的 条评论
为什么被折叠?
 到【灌水乐园】发言


