Linux shell编程学习笔记64:vmstat命令 获取进程、内存、虚拟内存、IO、cpu等信息_linux

0 前言

在系统安全检查中,通常要收集进程、内存、IO等信息。Linux提供了功能众多的命令来获取这些信息。今天我们先研究vmstat命令。

1.vmstat命令的功能、用法、选项说明和注意事项

1.1 vmstat命令的功能

vmstat是 Virtual Meomory Statistics(虚拟内存统计)的缩写,可以对系统的进程情况、内存使用情况、交换页和   I/O 块使用情况、中断以及 CPU 使用情况进行统计并报告相应的信息。

我们可以使用命令vmstat --help 来查看 vmstat命令的帮助信息。 
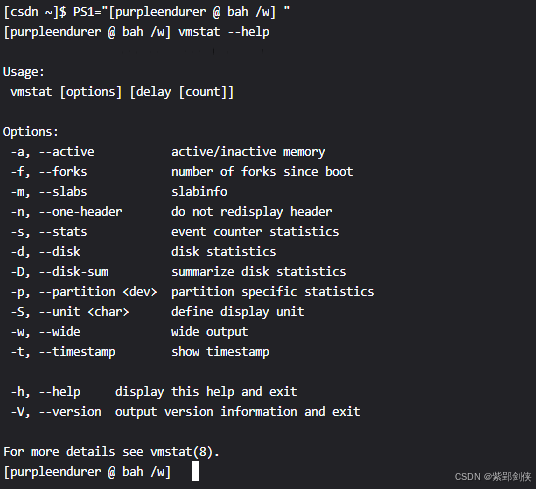
[purpleendurer @ bah /w] vmstat --help

Usage:
 vmstat [options] [delay [count]]

Options:
 -a, --active           active/inactive memory
 -f, --forks            number of forks since boot
 -m, --slabs            slabinfo
 -n, --one-header       do not redisplay header
 -s, --stats            event counter statistics
 -d, --disk             disk statistics
 -D, --disk-sum         summarize disk statistics
 -p, --partition <dev>  partition specific statistics
 -S, --unit <char>      define display unit
 -w, --wide             wide output
 -t, --timestamp        show timestamp

 -h, --help     display this help and exit
 -V, --version  output version information and exit

For more details see vmstat(8).
[purpleendurer @ bah /w]
  • 1.
  • 2.
  • 3.
  • 4.
  • 5.
  • 6.
  • 7.
  • 8.
  • 9.
  • 10.
  • 11.
  • 12.
  • 13.
  • 14.
  • 15.
  • 16.
  • 17.
  • 18.
  • 19.
  • 20.
  • 21.
  • 22.
  • 23.


Linux shell编程学习笔记64:vmstat命令 获取进程、内存、虚拟内存、IO、cpu等信息_学习笔记_02

1.2 vmstat命令的用法

 vmstat [选项] [刷新延时 [刷新次数]]

1.3 vmstat命令的选项说明

选项

说明

-a

--active

活动/非活动内存

-f

--forks

显示自启动以来的 fork 数量

fork是任何在保持活动状态的同时生成另一个进程的进程。

这里的 fork 数量包括 fork、vfork 以及 clone 等系统调用!

-m

--slabs

slabinfo

-n

--one-header

不重新显示标头

-s

--stats

事件计数器统计

-d

---disk

磁盘统计信息

-D

--disk-sum

汇总磁盘统计信息

-p

--partition <dev>

分区特定统计信息

-S

--unit <char>

定义输出的结果中的显示单位,

内存数据的单位默认是 KB,可以通过 -S 选项调整显示的单位,有下面几种单位可供选择:

  • k:1000 bytes
  • K:1024 bytes
  • m:1000 * 1000 bytes
  • M:1024 * 1024 bytes

注意:-S 选项对 si、 so 字段无效

-w

--wide

宽输出

vmstat 结果中的某些字段的数字有时会比较长,而且跟字段名的位置有偏差, 不太适合人类的观看习惯,-w 选项可以按照宽模式显示数据,使结果看起来更直观,下图是分别未使用宽模式和使用了宽模式的一个对比!

-t

--timestamp

显示时间戳

-h

--help

显示此帮助并退出

-V

--version

输出版本信息并退出

1.4 注意事项

  1. 运行 vmstat 不须要特别的使用权限
  2. 这些系统信息是用来向用户提供分析系统瓶颈问题信息的。
  3. linux在计算进程情况时不将正在运行的 vmstat 自己计算进去。
  4. 当前所在的 linux 块的大小都是 1K,而 CD-ROM 文件系统的块大小为 2K。
  5. 对于 slabinfo,需要使用 -m 命令行选项。请注意,您的 Linux 发行版内核需要支持 slabinfo 才能使用此选项。如果支持,则您需要使用 sudo 权限运行该命令。

2 vmstat命令实例

2.1 vmstat : 显示当前进程、内存、虚拟内存、读写、系统、cpu 信息

[purpleendurer @ bash ~] vmstat
procs -----------memory---------- ---swap-- -----io---- -system-- ------cpu-----
 r  b   swpd   free   buff  cache   si   so    bi    bo   in   cs us sy id wa st
 3  0      0 2014768  39912 1532180    0    0   347  1611  443  752  2  1 96  1  0
[purpleendurer @ bash ~]
  • 1.
  • 2.
  • 3.
  • 4.
  • 5.


Linux shell编程学习笔记64:vmstat命令 获取进程、内存、虚拟内存、IO、cpu等信息_内存管理_03

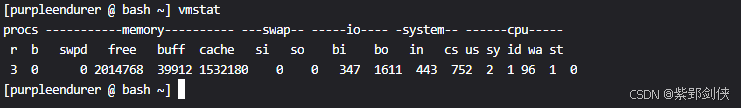
命令执行后返回的信息包括 procs(进程)、memory(内存)、swap(交换分区 或 虚拟内存)、io(磁盘读/写)、system(系统)、cpu 共6个部分内容。

每个部分的含义如下:

字段

含义

procs


  • r :等待运行的进程数,数量越大,系统越繁忙。
  • b:不可被唤醒的进程数量,数量越大,系统越繁忙。
  • w:被交换出去的可运行的进程数。

 此数由 linux 计算得出,但 linux 并不耗尽交换空间

这里的不可中断是指 一个进程在执行某些系统调用时进入的状态,在这种状态下,进程被阻塞,并且不能被中断,直到完成系统调用!

memory

  • swpd :虚拟内存的使用情况,单位为 KB。
  • free   :空闲的内存容量,单位为 KB。
  • buff   :缓存I/O操作的内存容量,单位为 KB。
  • cache:缓存文件系统数据块的内存容量,单位为 KB。
  • inact  :非活跃内存大小,即被标明可回收的内存,区别于free和active
  • active:活跃的内存大小

swap

  • si :从磁盘交换到内存的交换页数量,单位为 KB。
  • so:从内存交换到磁盘的交换页数量,单位为 KB。

io

  • bi :从块设备读入的块数(读磁盘),单位是块/秒。
  • bo:写到块设备的块数(写磁盘),单位是块/秒。

system

  • in:每秒的中断数,包括时钟中断。
  • cs:每秒的环境(上下文)切换次数。

cpu

  • us :(user time)用户进程消耗 CPU 运算时间的百分比。
  • sy :(system time) 系统进程消耗cpu运算时间的百分比。
  • id  :(idle)空闲 CPU 的百分比。
  • wa:(wait)等待 I/O 所消耗的 CPU 百分比。
  • st  :(steal)被虚拟机所盗用的 CPU 百分比。

 2.2    vmstat -a : 显示活动/非活动内存

[purpleendurer @ bash ~] vmstat
procs -----------memory---------- ---swap-- -----io---- -system-- ------cpu-----
 r  b   swpd   free   buff  cache   si   so    bi    bo   in   cs us sy id wa st
 3  0      0 2014768  39912 1532180    0    0   347  1611  443  752  2  1 96  1  0
[purpleendurer @ bash ~] vmstat -a
procs -----------memory---------- ---swap-- -----io---- -system-- ------cpu-----
 r  b   swpd   free  inact active   si   so    bi    bo   in   cs us sy id wa st
 4  0      0 2014440 1557064  89764    0    0   309  1436  431  742  2  1 96  1  0
[purpleendurer @ bash ~]
  • 1.
  • 2.
  • 3.
  • 4.
  • 5.
  • 6.
  • 7.
  • 8.
  • 9.

Linux shell编程学习笔记64:vmstat命令 获取进程、内存、虚拟内存、IO、cpu等信息_内存管理_04

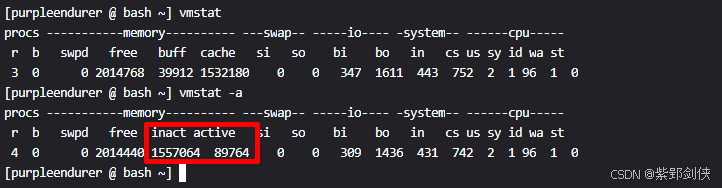
我们对比执行vmstat 和 vmstat -a 命令返回的信息,可以看到, vmstat -a 命令返回的memory部分中,原来属于buff和cache的位置 显示了 inact 和 active 两个信息。 

2.3 vmstat -d:显示磁盘统计信息

[purpleendurer @ bash ~] vmstat -d
disk- ------------reads------------ ------------writes----------- -----IO------
       total merged sectors      ms  total merged sectors      ms    cur    sec
vda     5730   2258  678968    7095  10127  44510 3156280  206114      0     10
zram0      0      0       0       0      0      0       0       0      0      0
[purpleendurer @ bash ~]
  • 1.
  • 2.
  • 3.
  • 4.
  • 5.
  • 6.


Linux shell编程学习笔记64:vmstat命令 获取进程、内存、虚拟内存、IO、cpu等信息_内存管理_05

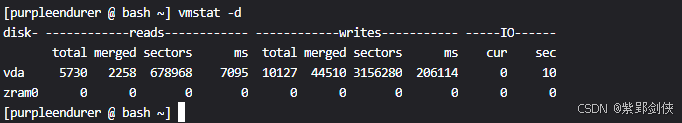
命令返回信息包括 disk(磁盘名称)、reads(读)、writes(写)、IO(输入输出)四部分内容,具体说明如下:

字段

含义

disk

  • VDA:是一种Linux内核的驱动程序它在虚拟环境中提供了与实体硬件磁盘交互的方式。 如果我们在虚拟机中添加了新的硬盘,那么这个硬盘就会被创建为一个虚拟磁盘,并由VDA驱动来进行管理和操作。
  • zram: 最初被称为 “compcache”,即 “压缩的高速缓存”。事实证明,zram 是一个用于创建内存内压缩缓存的工具,特别是作为交换空间使用。

reads

  • total       : 成功读取的总数
  • merged  :分组读取(产生一个 IO)
  • sectors   :成功读取的扇区数
  • ms          :读取花费的时间,单位为毫秒

writes

  • total       : 成功写入的总数
  • merged  :分组写入(产生一个 IO)
  • sectors   :成功写入的扇区数
  • ms          :写入花费的时间,单位为毫秒

IO

  • cur:正在进行的IO
  • s   :IO花费的时间,单位为秒

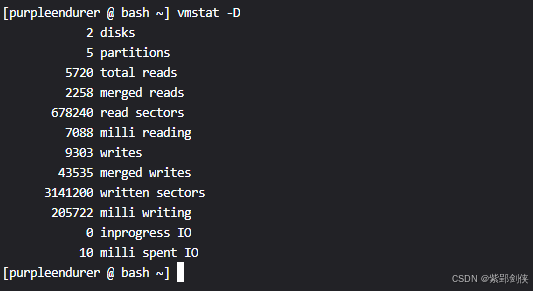
2.4 vmstat -D:汇总磁盘统计信息

[purpleendurer @ bash ~] vmstat -D
            2 disks 
            5 partitions 
         5720 total reads
         2258 merged reads
       678240 read sectors
         7088 milli reading
         9303 writes
        43535 merged writes
      3141200 written sectors
       205722 milli writing
            0 inprogress IO
           10 milli spent IO
[purpleendurer @ bash ~]
  • 1.
  • 2.
  • 3.
  • 4.
  • 5.
  • 6.
  • 7.
  • 8.
  • 9.
  • 10.
  • 11.
  • 12.
  • 13.
  • 14.

Linux shell编程学习笔记64:vmstat命令 获取进程、内存、虚拟内存、IO、cpu等信息_虚拟内存_06

信息

说明

 2 disks            

磁盘数

5 partitions         

分区数

 5720 total reads

读取数据块数

 2258 merged reads      

分组读取(产生一个 IO)数

678240 read sectors

读取的扇区个数

7088 milli reading

读取时间,毫秒

9303 writes

写入的数据块数

43535 merged writes

分组写入(产生一个 IO)数

3141200 written sectors

已写的扇区个数

205722 milli writing

写入时间,毫秒

0 inprogress IO

进行中的IO个数

10 milli spent IO

IO花费的时间,毫秒

2.5 vmstat -f:显示自启动以来的 fork 数量

[purpleendurer @ bash ~] vmstat -f
         1391 forks
[purpleendurer @ bash ~]
  • 1.
  • 2.
  • 3.

Linux shell编程学习笔记64:vmstat命令 获取进程、内存、虚拟内存、IO、cpu等信息_虚拟内存_07

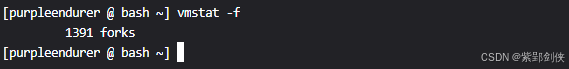
可见,自启动以来的 fork 数量为1391。

2.6  vmstat -p /dev/vda1: 查看分区/dev/vda1的信息

[purpleendurer @ bash ~] lsblk
NAME   MAJ:MIN RM  SIZE RO TYPE MOUNTPOINT
vda    253:0    0   40G  0 disk 
├─vda4 253:4    0  9.5G  0 part 
├─vda2 253:2    0  127M  0 part 
├─vda5 253:5    0   30G  0 part /dev/termination-log
├─vda3 253:3    0  384M  0 part 
└─vda1 253:1    0    1M  0 part 
[purpleendurer @ bash ~] vmstat -p /dev/vda1
vda1          reads   read sectors  writes    requested writes
                  14        112          0          0
[purpleendurer @ bash ~]
  • 1.
  • 2.
  • 3.
  • 4.
  • 5.
  • 6.
  • 7.
  • 8.
  • 9.
  • 10.
  • 11.
  • 12.

Linux shell编程学习笔记64:vmstat命令 获取进程、内存、虚拟内存、IO、cpu等信息_linux_08

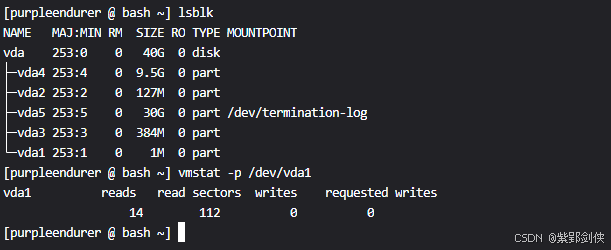
我们先使用lsblk命令查看当 前系统中的分区信息,然后指定查看分区/dev/vda1的信息。

命令返回的分区/dev/vda1的信息含义如下:

信息

含义

vda1

分区名称

reads                  14

读取的数据块数

read sectors      112

读取的扇区数

writes                    0

写入的数据块数

requested writes   0

请求写入的数据块数

2.7 vmstat -s:显示事件计数器统计信息
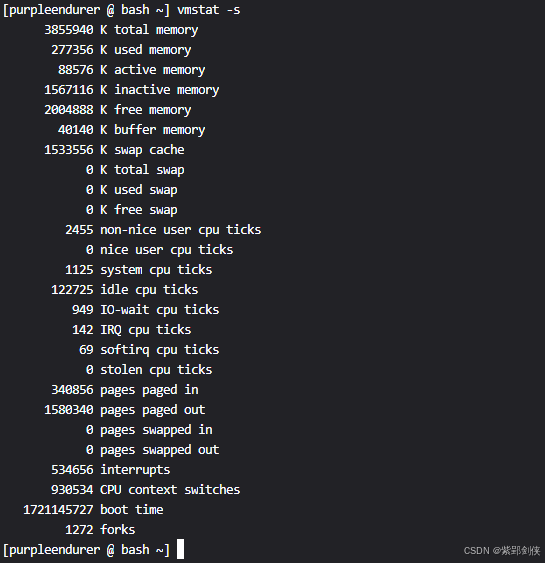
[purpleendurer @ bash ~] vmstat -s
      3855940 K total memory
       277356 K used memory
        88576 K active memory
      1567116 K inactive memory
      2004888 K free memory
        40140 K buffer memory
      1533556 K swap cache
            0 K total swap
            0 K used swap
            0 K free swap
         2455 non-nice user cpu ticks
            0 nice user cpu ticks
         1125 system cpu ticks
       122725 idle cpu ticks
          949 IO-wait cpu ticks
          142 IRQ cpu ticks
           69 softirq cpu ticks
            0 stolen cpu ticks
       340856 pages paged in
      1580340 pages paged out
            0 pages swapped in
            0 pages swapped out
       534656 interrupts
       930534 CPU context switches
   1721145727 boot time
         1272 forks
[purpleendurer @ bash ~]
  • 1.
  • 2.
  • 3.
  • 4.
  • 5.
  • 6.
  • 7.
  • 8.
  • 9.
  • 10.
  • 11.
  • 12.
  • 13.
  • 14.
  • 15.
  • 16.
  • 17.
  • 18.
  • 19.
  • 20.
  • 21.
  • 22.
  • 23.
  • 24.
  • 25.
  • 26.
  • 27.
  • 28.


Linux shell编程学习笔记64:vmstat命令 获取进程、内存、虚拟内存、IO、cpu等信息_虚拟内存_09

 返回信息的含义如下:

信息

含义

     3855940 K total memory       

内存总数

      277356 K used memory 

已使用内存数

        88576 K active memory

活跃内存数

      1567116 K inactive memory

非活跃内存数

      2004888 K free memory

未分配使用内存数

         40140 K buffer memory

缓存I/O操作的内存容数

     1533556 K swap cache

缓存文件系统数据块的内存数

               0 K total swap

虚拟内存总数

                0 K used swap

已使用虚拟内存数

                0 K free swap

未分配使用虚拟内存数

         2455 non-nice user cpu ticks

非友好用户占用的CPU时间

                0 nice user cpu ticks

友好用户占用的CPU时间

          1125 system cpu ticks

系统占用的CPU时间

       122725 idle cpu ticks

空闲的CPU时间

            949 IO-wait cpu ticks

等待IO操作的占用的CPU时间

             142 IRQ cpu ticks

(来自设备的)硬中断请求占用的CPU时间

               69 softirq cpu ticks

软中断请求占用的CPU时间

                 0 stolen cpu ticks

虚拟机盗用的 CPU 百分比

       340856 pages paged in

块设备数据的读入内存的页数

      1580340 pages paged out

写入块设备的内存页数

                  0 pages swapped in

从块设备swap区中读入的页数

                  0 pages swapped out

从块设备swap区中读出的页数

        534656 interrupts

中断数

 930534 CPU context switches

CPU上下文切换次数

    1721145727 boot time

系统运行时间

           1272 forks

fork数

2.8 vmstat -t -w:宽行显示时间戳

[purpleendurer @ bash ~] vmstat -t
procs -----------memory---------- ---swap-- -----io---- -system-- ------cpu----- -----timestamp-----
 r  b   swpd   free   buff  cache   si   so    bi    bo   in   cs us sy id wa st                 CST
 2  0      0 2012752  40516 1532440    0    0   197   919  386  696  2  1 97  0  0 2024-07-16 23:38:12
[purpleendurer @ bash ~] vmstat -t -w
procs -----------------------memory---------------------- ---swap-- -----io---- -system-- --------cpu-------- -----timestamp-----
 r  b         swpd         free         buff        cache   si   so    bi    bo   in   cs  us  sy  id  wa  st                 CST
 3  0            0      2013128        40676      1532556    0    0   183   855  381  691   2   1  97   0   0 2024-07-16 23:39:17
[purpleendurer @ bash ~]
  • 1.
  • 2.
  • 3.
  • 4.
  • 5.
  • 6.
  • 7.
  • 8.
  • 9.

Linux shell编程学习笔记64:vmstat命令 获取进程、内存、虚拟内存、IO、cpu等信息_内存管理_10

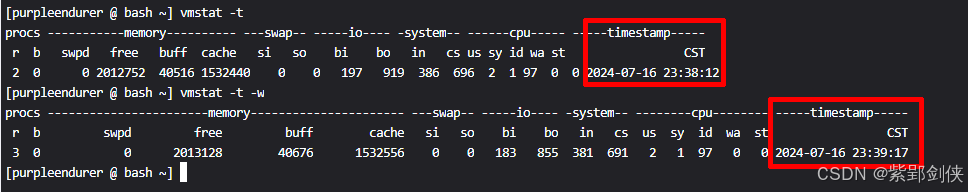
返回的命令执行结果中增加了timestamp的内容。

我们也可以从对比中看到-w选项的作用。

2.9 vmstat -S M -t 1 3 :以M为单位,延迟1秒输出3次,带时间戳

[purpleendurer @ bash ~] vmstat -S M -t 1 3 
procs -----------memory---------- ---swap-- -----io---- -system-- ------cpu----- -----timestamp-----
 r  b   swpd   free   buff  cache   si   so    bi    bo   in   cs us sy id wa st                 CST
 2  0      0   1955     39   1497    0    0   170   791  386  703  1  1 97  0  0 2024-07-17 00:18:50
 0  0      0   1955     39   1497    0    0     0     0  632 1200  0  1 99  0  0 2024-07-17 00:18:51
 0  0      0   1955     39   1497    0    0     0    16  839 1801  2  0 98  1  0 2024-07-17 00:18:52
[purpleendurer @ bash ~]
  • 1.
  • 2.
  • 3.
  • 4.
  • 5.
  • 6.
  • 7.

Linux shell编程学习笔记64:vmstat命令 获取进程、内存、虚拟内存、IO、cpu等信息_磁盘_11

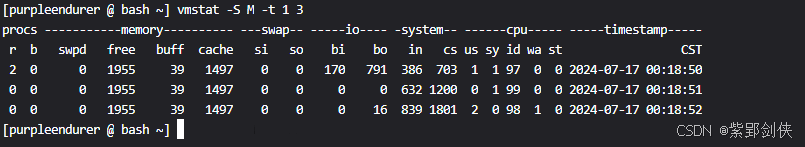
从时间戳可以看出来,命令每隔1秒钟显示一次信息。