


最新在做跟echarts tree相关的东西,做了一张效果图如图:
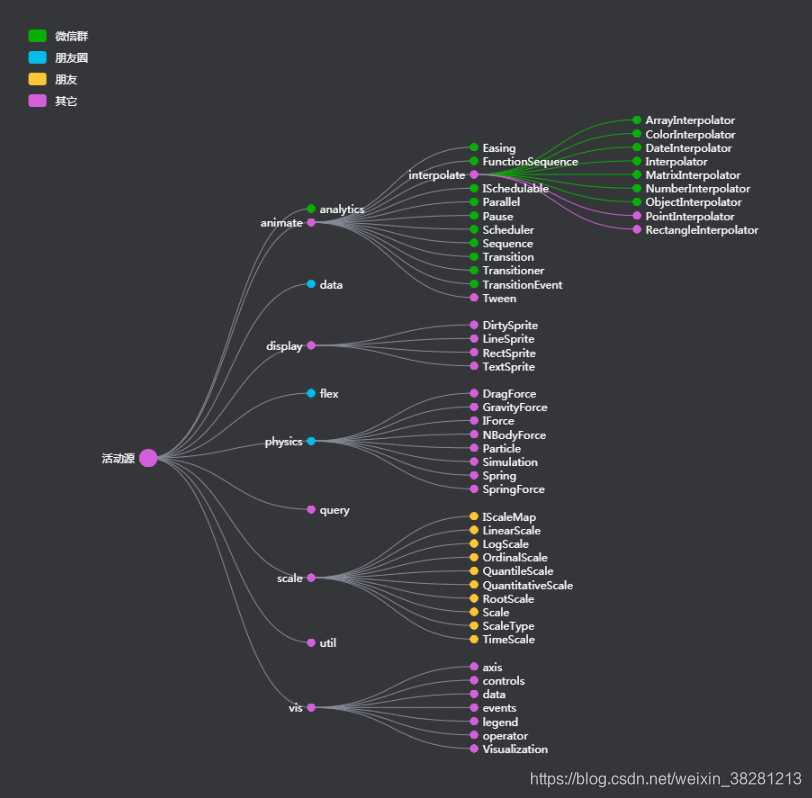
比较常用的地方有如下这些:
function clickFun(param) {
        console.log(param);
        param.data.symbol = 'image://http://www.viastreaming.com/images/apple_logo2.png';
        //远程加载图片最好先预加载过来,避免下载图标延迟。 /**var oImg = new Image();oImg.src = img;**/
        console.log(param.data.cusField);
        chart.refresh(); //一定要refresh,否则不起作用
    }
myChart.on('click', function(params){
console.log(params);
if(params.data.url){
windodw.open(params.data.url);
}
});
windodw.onresize = function(){
var t= setTimeout(function(){
myChart.resize();
});
};
参考网站:http://blog.51cto.com/11095961/1951206
经常会用到需要将图表的数据进行分类统计,经常需要去映射,映射的方法可以参考下面的这个:http://www.echartsjs.com/tutorial.html#%E6%95%B0%E6%8D%AE%E7%9A%84%E8%A7%86%E8%A7%89%E6%98%A0%E5%B0%84
var option = {
        tooltip: {
            trigger: 'item',
            formatter: '{b}:{c}',
            hideDelay: 0 // chart.refresh();刷新时会维持当时图表的所有状态,所以设置隐藏延迟为0,否则在快速选择另一个节点时(尤其是数据比较多时)导致无法显示选择中的tooltip
            //无法完全避免但是很大减轻了副作用
        },
        series: [{
            name: '树图',
            type: 'tree',
            orient: 'horizontal', // vertical horizontal
            rootLocation: { x: '10%', y: '60%' }, // 根节点位置  {x: 'center',y: 10}
            nodePadding: 20, //智能定义全局最小节点间距,不能定义层级节点间距,有点搓。
            symbol: 'circle',
            symbolSize: 40,//tree图上的原型的大小
            roam: true,//设置次参数后,针对该图表可以放大和缩小,移动
            data: [{
                name: '手机',
                value: 6,
                symbolSize: [90, 70],
                cusField: 'category',
                symbol: 'image://http://www.iconpng.com/png/ecommerce-business/iphone.png',//可以使用该属性来设置原件的形状和大小,默认的circle需要蔽掉原先的点击和默认的样式,容易导致设置成的颜色不生效。
                itemStyle: {
                    normal: {
                        label: {
                            show: true,
                            position: 'right',

                        }
                    }
                },
                children: [{
                        name: '小\n米', //由于label的formatter存在bug,所以无法通过html进行格式化,如果要换行要用\n
                        value: 4,
                        symbol: 'image://http://pic.58pic.com/58pic/12/36/51/66d58PICMUV.jpg',
                        symbolSize: [60, 60],
                        cusField: 'product',
                        children: [{
                            name: '小米11',
                            symbol: 'circle',
                            itemStyle: {
                                normal: {
                                    label: {
                                        show: true,
                                        position: 'bottom',
                                        formatter: '{b}--->>>'
                                    }
                                }
                            }
                        }],
                        itemStyle: {
                            normal: {
                                label: {
                                    show: true,
                                    position: 'right',
                                }
                            }
                        }
                    },
                    {
                        name: '苹果',
                        symbol:
                          'image://http://www.viastreaming.com/images/apple_logo2.png',
                        symbolSize: [60, 60],
                        cusField: 'product',
                        itemStyle: {
                            normal: {
                                label: {
                                    show: false
                                }

                            }
                        },
                        value: 4
                    }

                ]
            }]
        }]
};参考网址:https://blog.csdn.net/u014744118/article/details/79914133;这篇博客中有关于echarts的事件响应和重绘事件http://echarts.baidu.com/echarts2/doc/example/tree1.html
如果是比较简单的图表样式,百度echarts提供了在线编辑图表样式的操作,可以直接在线编辑样式,直接生成代码(不过提供的可以在线编辑的图表样式非常有限)~
设置图表上的工具按钮方法
你需要看的是 toolbox.feature
根据文档说明
你修改 feature下的组件icon内容
支持svg和图片
所以 你要做的就是 用一个带颜色svg 或 彩色的图片 做icon即可
你可以尝试官方的案例测试
toolbox: {
show: true,
feature: {
dataView: {readOnly: false},
restore: {},
saveAsImage: {}
},
iconStyle:{
normal:{
color:'white',//设置颜色
}
}
},
toolbox: {
  show: true,
  feature: {
    myTool1: {
      show: true,
      title: '自定义扩展方法1',
      icon: 'path://M432.45,595.444c0,2.177-4.661,6.82-11.305,6.82c-6.475,0-11.306-4.567-11.306-6.82s4.852-6.812,11.306-6.812C427.841,588.632,432.452,593.191,432.45,595.444L432.45,595.444z M421.155,589.876c-3.009,0-5.448,2.495-5.448,5.572s2.439,5.572,5.448,5.572c3.01,0,5.449-2.495,5.449-5.572C426.604,592.371,424.165,589.876,421.155,589.876L421.155,589.876z M421.146,591.891c-1.916,0-3.47,1.589-3.47,3.549c0,1.959,1.554,3.548,3.47,3.548s3.469-1.589,3.469-3.548C424.614,593.479,423.062,591.891,421.146,591.891L421.146,591.891zM421.146,591.891',
      onclick: function (){
        alert('myToolHandler1')
      }
    },
    myTool2: {
      show: true,
      title: '自定义扩展方法',
      icon: 'image://http://echarts.baidu.com/images/favicon.png',
      onclick: function (){
        alert('myToolHandler2')
      }
    }
  }
}


 2212
2212


 被折叠的 条评论
为什么被折叠?
被折叠的 条评论
为什么被折叠?
 到【灌水乐园】发言


