matlab双峰模型,为什么用MATLAB画的高斯双峰曲线不能永双高斯函数拟合?

clc;

clear;

%% 绘制自定的双峰高斯曲线

A1=2;

mu1=35;

sigma1=10;

A2=3;

mu2=90;

sigma2=10;

x=0:0.1:200

y=A1*exp(-(x-mu1).^2/(2*sigma1^2))+A2*exp(-(x-mu2).^2/(2*sigma2^2))

plot(x,y,'*');

hold on

y1=fliplr(y)/fliplr(max(y));

x1=fliplr(x)/fliplr(max(x));

ymax=max(y);

%%  尝试用高斯拟合自行拟合并绘图

%fun=fittype('nA1*exp(-(x-nmu1)^2/(2*nsigma1^2))+nA2*exp(-(x-nmu2)^2/(2*nsigma2^2))')

%[cf,gof]=fit(x1(:),y1(:),fun,'Start',[]);

%% Interpolate the data

% k=1:length(x1);

% ki=linspace(1,length(x1),2000);

% xi=interp1(k,x1,ki,'linear');%一维线性插值

% yi=interp1(k,y1,ki,'linear');

% Yi=cf.nA1*exp(-(xi-cf.nmu1).^2/(2*cf.nsigma1^2))*ymax+cf.nA2*exp(-(xi-cf.nmu2).^2/(2*cf.nsigma2^2))*ymax

% plot(xi*max(x),Yi,'b');

%%  用matlab自带高斯拟合进行拟合并绘图

pop=y';

cdate=x';

ftype = fittype('Gauss2');

[f,gof,output]= fit(cdate,pop,ftype);

x1=x;

y1=y;

y2=f(x1);

plot(x1,y1,'r.',x1,y2,'k-','LineWidth',2),xlabel('t'),ylabel('f(t)');

legend('原始数据点','拟合曲线')

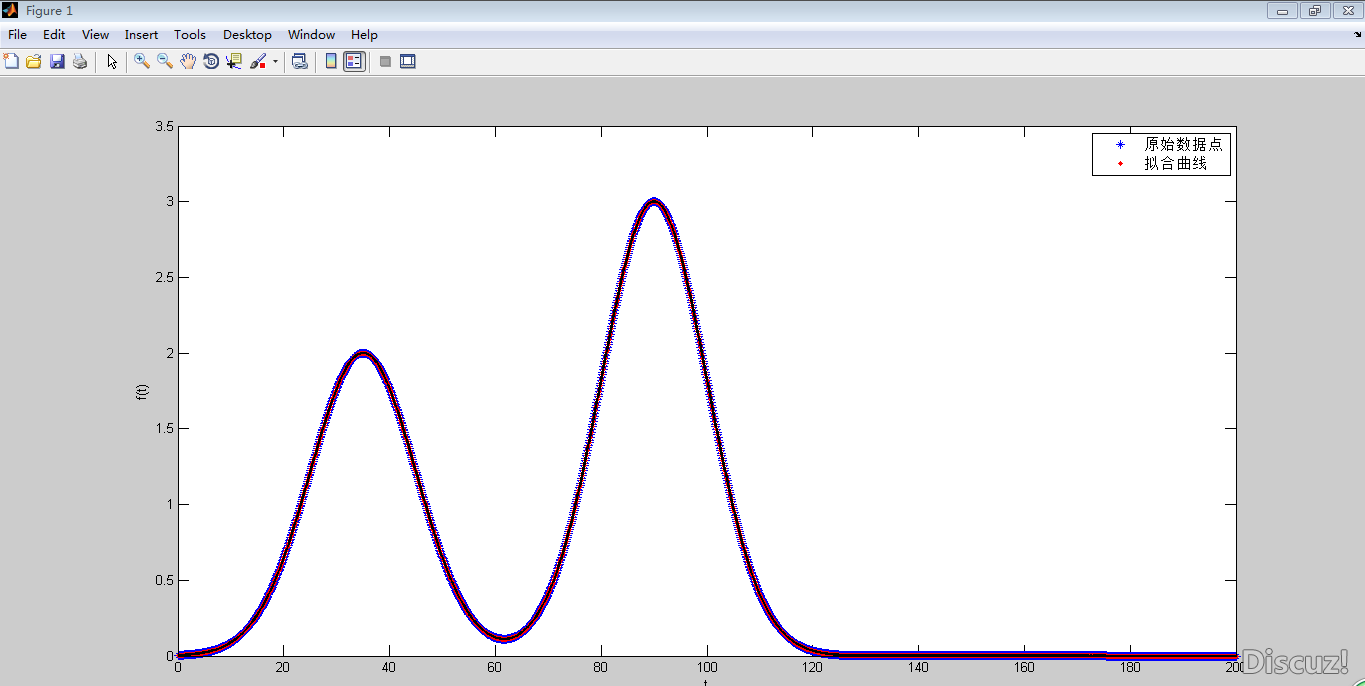
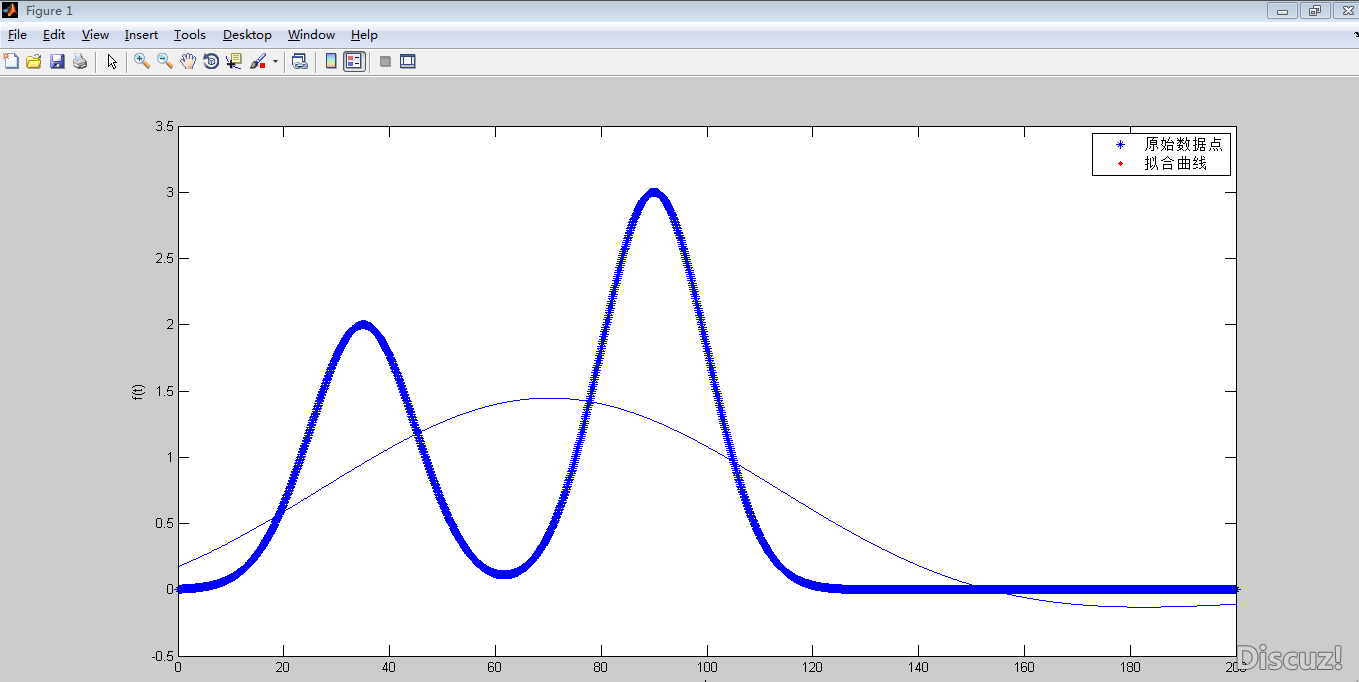
以上是代码,我用双高斯函数拟合时始终不能拟出两个高斯峰,但是用CTOOL里的'Gauss2'就可以拟合的非常好?

1.PNG

(32.14 KB, 下载次数: 3)

2017-4-5 12:36 上传

442a53943febe9465fc072b4fbe10813.gif

b2a5a3e0dcc7d508e00275fe42fce1b5.gif

用GAUSS2拟合

0b6a82679b4bc78fbdba90c0c7f7ebab.png

2.PNG

(28.78 KB, 下载次数: 2)

2017-4-5 12:36 上传

442a53943febe9465fc072b4fbe10813.gif

b2a5a3e0dcc7d508e00275fe42fce1b5.gif

用自己给的双高斯函数拟合

d194d1749e38509bebdbcdc1dfa92fc4.png

  • 0
    点赞
  • 3
    收藏
    觉得还不错? 一键收藏
  • 0
    评论
% This folder contains a collection of "fitting" functions. % (Some has demo options - the third section) % The GENERAL input to the functions should be samples of the distribution. % % for example, if we are to fit a normal distribution ('gaussian') with a mean "u" and varaince "sig"^2 % then the samples will distribute like: % samples = randn(1,10000)*sig + u % %fitting with Least-Squares is done on the histogram of the samples. % fitting with Maximum likelihood is done directly on the samples. % % % Contents of this folder % ======================= % 1) Maximum likelihood estimators % 2) Least squares estimators % 3) EM algorithm for estimation of multivariant gaussian distribution (mixed gaussians) % 4) added folders: Create - which create samples for the EM algorithm test % Plot - used to plot each of the distributions (parametric plot) % % % % % % Maximum likelihood estimators % ============================= % fit_ML_maxwell - fit maxwellian distribution % fit_ML_rayleigh - fit rayleigh distribution % (which is for example: sqrt(abs(randn)^2+abs(randn)^2)) % fit_ML_laplace - fit laplace distribution % fit_ML_log_normal- fit log-normal distribution % fit_ML_normal - fit normal (gaussian) distribution % % NOTE: all estimators are efficient estimators. for this reason, the distribution % might be written in a different way, for example, the "Rayleigh" distribution % is given with a parameter "s" and not "s^2". % % % least squares estimators % ========================= % fit_maxwell_pdf - fits a given curve of a maxwellian distribution % fit_rayleigh_pdf - fits a given curve of a rayleigh distribution % % NOTE: these fit function are used on a histogram output which is like a sampled % distribution function. the given curve MUST be normalized, since the estimator % is trying to fit a normalized distribution function. % % % % % Multivariant Gaussian distribution % ================================== % for demo of 1

“相关推荐”对你有帮助么?

  • 非常没帮助
  • 没帮助
  • 一般
  • 有帮助
  • 非常有帮助
提交
评论
添加红包

请填写红包祝福语或标题

红包个数最小为10个

红包金额最低5元

当前余额3.43前往充值 >
需支付:10.00
成就一亿技术人!
领取后你会自动成为博主和红包主的粉丝 规则
hope_wisdom
发出的红包
实付
使用余额支付
点击重新获取
扫码支付
钱包余额 0

抵扣说明:

1.余额是钱包充值的虚拟货币,按照1:1的比例进行支付金额的抵扣。
2.余额无法直接购买下载,可以购买VIP、付费专栏及课程。

余额充值