


记录
首先pip install pyecharts
代码
from pyecharts import Bar
from pyecharts import Pie
from pyecharts.engine import create_default_environment
from pyecharts.utils import write_utf8_html_file
def report_form():
attr=["衬衫","羊毛衫","雪纺衫"]
v1=[5,20,36]##数量
v2=[10,12,28]
##bar
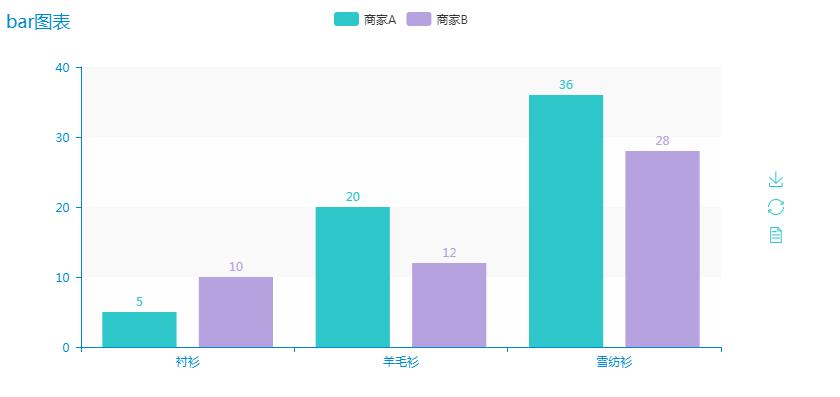
bar=Bar("bar图表")
bar.use_theme("macarons")##主题
bar.add(
"商家A",attr,v1,
is_splitline_show=False,##不显区域分隔线
is_label_show=True ##显示数据
)
bar.add("商家B",attr,v2,
is_splitline_show=False,
is_label_show=True
)
##pie
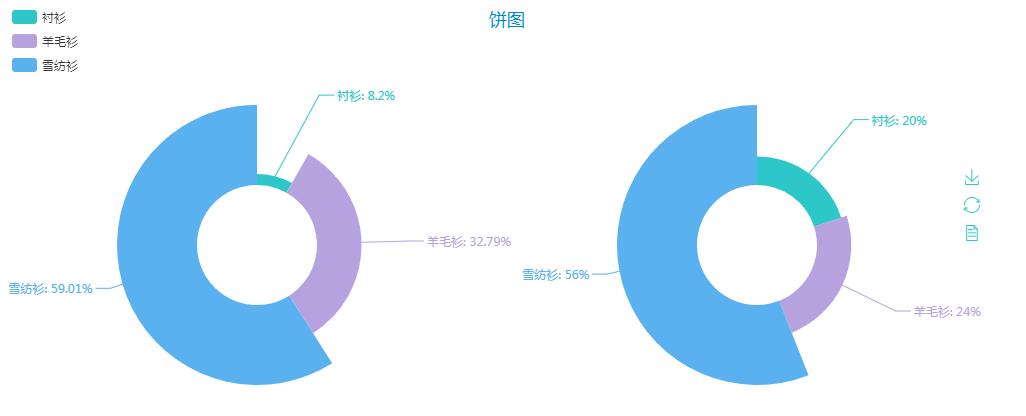
pie=Pie("饼图",title_pos='center',width=1000)
pie.use_theme("macarons")
pie.add("",attr,v1,center=[25,60],
radius=[30,70],
rosetype="radius", ##是否展示成南丁格尔图
legend_pos='left', ##图例位置
legend_orient='vertical', ##图例列表的布局朝向
is_label_show=True)
pie.add("",attr,v2,center=[75,60],
radius=[30,70],
rosetype="radius",
legend_pos='left',
legend_orient='vertical',
is_label_show=True)
##bar
env = create_default_environment("html")
env.render_chart_to_file(bar, path='bar.html')
##pie
env = create_default_environment("html")
env.render_chart_to_file(pie, path='pie.html')
report_form()
运行会生成bar.html,pie.html两个文件到代码文件当前目录,打开就是相应的表。
如果打开显示数据是空白的,装一下主题pip install echarts-themes-pypkg
图;
bar
pie


 3152
3152


 被折叠的 条评论
为什么被折叠?
被折叠的 条评论
为什么被折叠?
 到【灌水乐园】发言


