


先说测试结论结论
高可用性
这两个平台能够在有限的时间范围(不到1分钟)内管理故障转移操作。不过,事实证明,MySQL / Galera更加有效和一致。此结果是同步复制的直接结果,根据设计,它可以防止MySQL / Galera允许活动节点落后。
在我看来,Aurora中使用的复制方法是有效的,并且鉴于跨只读副本共享数据,因此故障转移应该更快地进行。
由于连接器而使测试失败,因此我觉得采用其他解决方案可能会带来一些惊喜(实际上,我也想对其进行测试)。
性能
在几乎所有情况下,Aurora的性能都优于或优于XtraDB Cluster。在某些情况下,Aurora存在缺点,如数据热点存在时。Aurora中的争论正在削弱性能,并引发错误(188)。但我希望我们很快会看到重大的发展。
关于Aurora的一般评论
产品发展迅速,基准测试结果可能在很短的时间内就过时了(这就是为什么进行可重复且可比较的测试很重要)。从我的角度来看,在这组测试中,Aurora清楚地表明了它更适合的地方:高端级别,重点是高可用性和CPU能力(而不关注成本)。
没有理由在中小型企业中使用Aurora:该平台不会像XtraDB Cluster这样的标准解决方案那样高效。但是,如果成本不是问题,并且应用程序需要大量的并行性,那么db.r3.8xlarge上的Aurora是一个很好的解决方案。
我仍然看到需要改进的空间(例如集群连接器,或者在完全停止后重新启动集群所花的时间,或者减少了争用)。但是我也有信心,由开发团队领导的工作将很快解决我的大部分(甚至更多)问题。
最后说明:最好将代码开源,以便社区可以做出贡献(但我理解不这样做的商业原因)
Some time ago, I published the article on AWS Aurora Benchmarking (AWS Aurora Benchmarking – Blast or Splash?), in which I analyzed the behavior of different solutions using synchronous replication in AWS environment. This blog follows up with some of the comments and suggestions I received regarding that post from the community and Amazon engineers.
I decided to perform another round of tests, keeping in mind comments and suggestions received.
I presented some of the results during the Percona conference in Santa Clara last April 2016. The following is the transposition that presentation, with more details.
Not interested in the preliminary descriptions? Go to the results section
Why new tests?
A very good question, with an easy answer.
Aurora is a product that is still under development and refinement: six months of development could present major changes in performance. Not only that, but the initial tests focused on entry-level solutions, meaning I was analyzing the kind of users that are currently starting their business and looking for a flexible solution that allows them to save money and scale.
This time, I put the focus on enterprise solutions by analyzing what an already well-established company would get when looking for a decent scalable solution.
These are two different scenarios.
Why so many (different) tests?
I used many different benchmarking tools, and I am still planning to run others. Why so? Why not simply use one of them?
Again, a simple answer. I used different tools because in some cases, they provide me a different way of accessing and using data. I also do not trust benchmarking tools, not even the ones I developed. I wanted to test the same thing using different tools and compare the results. ONLY if I see a common pattern, then would I consider the test valid. Personally, I tend to discard any test that is not consistent, or if the analysis performed is using a single benchmarking tool. In my opinion, being lazy is not an option when doing these kind of exercises.
About the tests
It was difficult to compare apples to apples here. And I think that is the main point to keep in mind.
Aurora is not a standard RDS solution, like we are used to. Aurora looks like MySQL, smells like MySQL, but is not vanilla MySQL. To achieve what they have, the engineers had to change many parts. The more you dig in, the more you realize there are significant differences.
Because of that, I had to focus more on identifying what each solution can do and compare the solutions against expectations, rather than comparing the numbers.
I was more interested to see what happen if:
- I have a burst of connections, and my application goes from 4K to 40K connections. Will it crash? Will it slow down?
- How long should I wait if a node fails?
- What should I not have in my schema design, to prevent bottlenecks?
Those are relevant questions in my opinion, more so than discovering that solution A has 3000 rows written/sec, and solution B has 3100. Or that I might (might) have some additional page rotation, file -> memory-> flushes because the amount of memory differs.
That is valuable information, for sure, but less valuable than having a decent understanding of which platform will help my business grow and remain stable.What is the right tool for the job? This is the question I am addressing.
Tests run
I had run three main kinds of tests:
- Performance and load stress
- High availability failover
- Response time (latency) from the application point of view
Performance and load stress
These tests were the most extensive and demanding.
I analyzed the capacity to serve the load under different conditions, from a light load up to full utilization, and some degree of resource saturation.
- The first set of tests were to evaluate a simple load on a single table, causing the table to become a hotspot and showing how the platform would manage the increasing contention.
- The second set of tests were to perform a similar load, but distributing it cross multiple tables and batching the operations. Parallelization, contention, scalability and distributed hotspots were in the picture.
The two above focused on write operations only, and were done using different tools (comparing the results as they were complementary).
- Third set of tests, using my own stress tool, were focused on R/W oriented usage. The tests were executed against multiple tables, performing CRUD actions, using simple and batch insert, reads by PK, index, by range, IN and exact match conditions.
- The fourth set of tests were performed using a TPC-C like load (OLTP).
- The fifth set of tests were using sysbench in OLTP mode, with 250 tables.
The scope of the last three set of tests was to identify how the platforms would manage the load, considering the following:
- Read and write contention on the same tables
- High level of parallelism (from the application)
- Possible hot-spots (TPCC district)
- Increasing utilization (memory, threads, IO)
- Saturation (connections)
Finally, all tests were run with fully utilized BufferPool.
The machines
Small boxes (first round of tests):
Shell
EIP = 1
VPC = 1
ELB=1
Subnets = 4 (1 public, 3 private)
HAProxy = 6
MHA Monitor (micro ec2) = 1
NAT Instance (EC2) =1 (hosting EIP)
DB Instances (EC2) = 3 (m4.xlarge) 16GB
Application Instances (EC2) = 6 (4)
EBS SSD 3000 PIOS
Aurora RDS node = 3 (db.r3.xlarge) 30GB
Large boxes (latest tests):
Shell
EIP = 1
VPC = 1
ELB=1
Subnets = 4 (1 public, 3 private)
HAProxy = 4
MHA Monitor (micro ec2) = 1
NAT Instance (EC2) =1 (hosting EIP)
DB Instances (EC2) = 3 (c3.8xlarge) 60GB
Application Instances (EC2) = 4
EBS SSD 5000 PIOS
Aurora RDS node = 3 (db.r3.8xlarge) 244GB
A note
It was pointed out to me that I deliberately chose to use an Ec2 solution for Percona XtraDB Cluster with less memory than the one available in Aurora. This is true, and we must take that into consideration. The reason for this is that the only Ec2 solution matching the memory of a db_r3.8xlarge is the d2.8xlarge.
I did try it, but the level of scalability I got (from the CPU point of view) was less efficient than the one available with c3.8xlarge. I decided to prefer CPU resources to memory, especially because I was going to test concurrency and parallelism in conjunction with the load increase.
From the result, I feel confident that I chose correctly – but I am open to comment.
The layout
This is what the setup looks like:
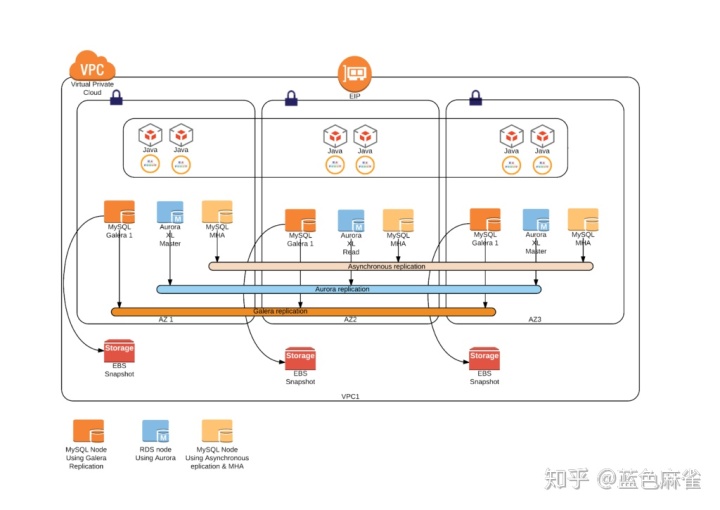
Where you read Java, those are the application nodes running the different test applications.
Two words about Aurora first
Aurora has a few key concepts that we must have clearly in mind, especially how it manages the writes across replica, and how connections are implemented.
The IO activity
To replicate the information across the different storage, Aurora only replicates FRM files and data coming from IB_LOGS. This is a quite significant advantage to other forms of replication, given the limited number of bytes that are replicated over the network (and also if they are replicated six times).
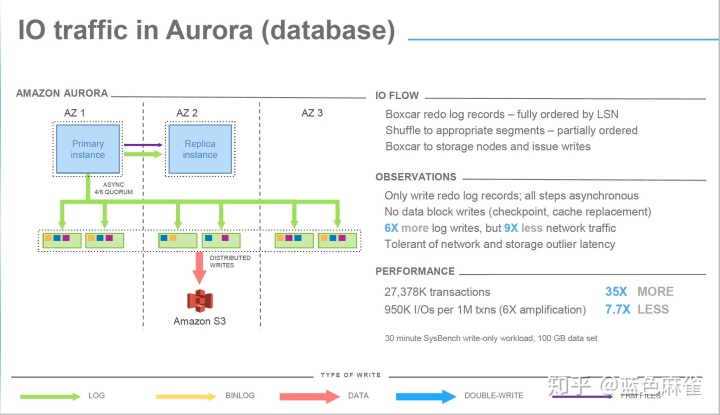
Another significant advantage is that Aurora does not use a double write buffer, which is obviously another blast (see the recent optimization in Percona Server https://www.percona.com/blog/2016/05/09/percona-server-5-7-parallel-doublewrite/ ).
In other words, writes in Aurora are organized by filling its commit queue and pushing the changes as group commit to the storage.
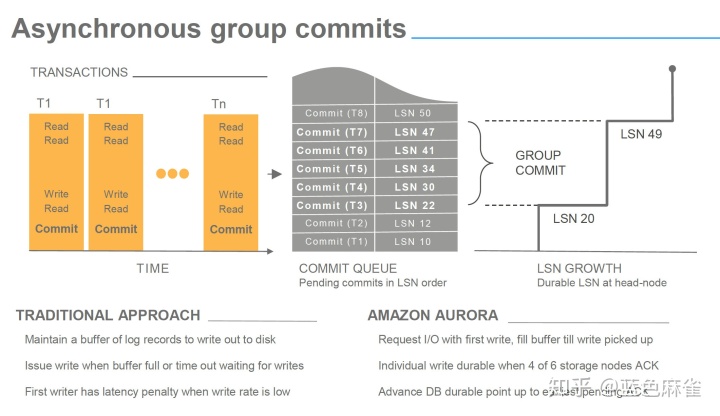
In some presentations, you might have seen that all steps are asynchronous. But is important to underline that a commit is acknowledged by Aurora when at least two availability zones (AZ) have received and written the incoming data related to that commit. Writes here mean received in the storage node incoming queue and with a quorum of four over six nodes.
This means that no matter what, data has to travel on the network to reach the final destination, and ACK signals come back before Aurora returns the ACK to the commit operation. The network is in the same region, but still it could represent an incognita about performance. No wonder we could have some latency at this stage!
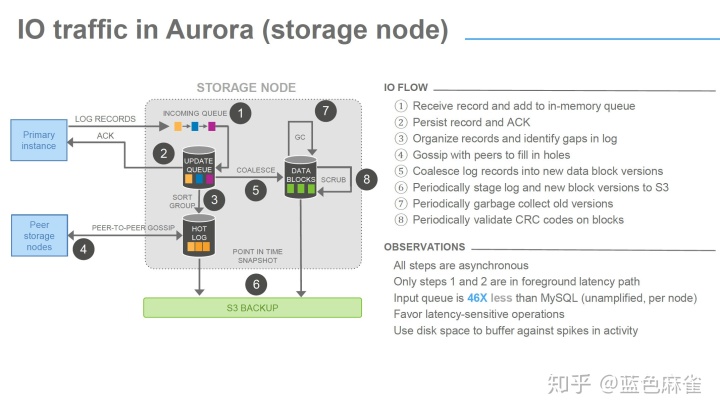
As you can see, what I am reporting is also confirmed in the image below (and in the observations). The point is that the impact of steps 1 – 2 is not obviously clear.
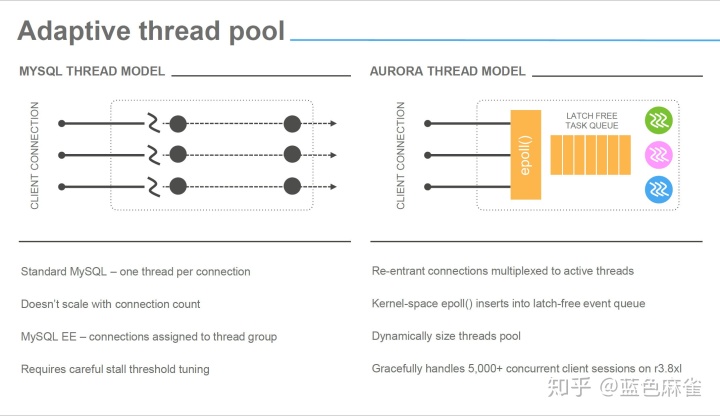
Thread pooling
Aurora also use thread pooling – a lot! That will become very clear later, and as more of the work is based on parallelism, the more efficient thread pooling seems to be.
In most cases, we are used to seeing CPUs on database servers not fully utilized, unless there is some heavy ordering operation or a bad query. That behavior is also (not only) a direct consequence of the connection-to-thread model, which implies a period of latency and stand by. In Aurora, the incoming connections are not following the same model. Instead, the pool redistributes the load of the incoming connection to a pool of threads, optimizing the latency period, resulting in a higher CPU utilization. Which is what you want from your resource: to be utilized and not waiting for something else to do its job.
The results
Without wasting more electronic ink, let see what comes out of this round of tests (not the final one by the way). To simplify the results, I will also report the graphs from the first set of tests but will focus on the latest. Small Boxes = SB, Large Boxes LB.
Small Boxes = SB, Large Boxes = LB.
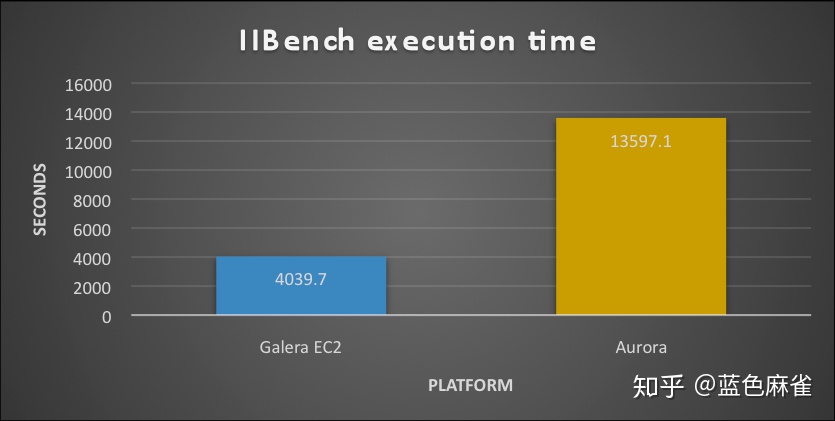
First Test: IIBench
As declared previously, my scope was to verify how the two platforms would have reacted to a simple load focus on inserts with a basic single table. The bufferpool was saturated before running the test.
SB
LB
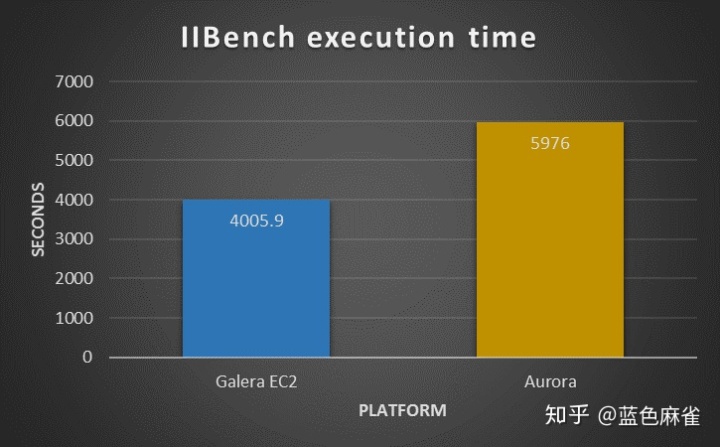
As we can see, in the presence of a hot spot the solution using Percona XtraDB Cluster outperformed Aurora, in both cases. What is notable, though, is that while XtraDB Cluster remained approximately around the same time/performance, Aurora is significantly reduced the time taken. This shows that Aurora was taking advantage of the more powerful platform, while XtraDB Cluster was not able to.
With further analyzation of the details, we notice that Aurora performs better atomically. It was able to manage more writes/second as well as rows and pages managed. But it was inconsistent: Aurora had performance hiccups at regular intervals. As such the final result was that it took more time to process the whole workload.
I was not able to dig to deeply, given some metrics are not fully available in Aurora. As such, I had to rely fully on Aurora engineers, who mentioned to me that hot-spot contention was a possible issue.
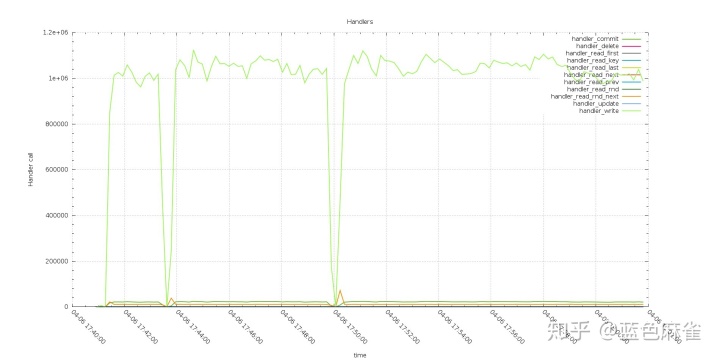
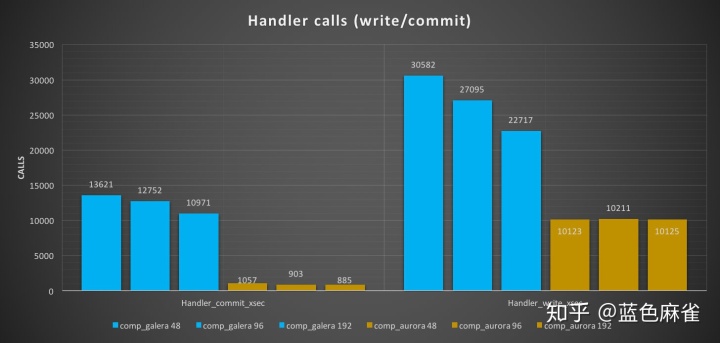
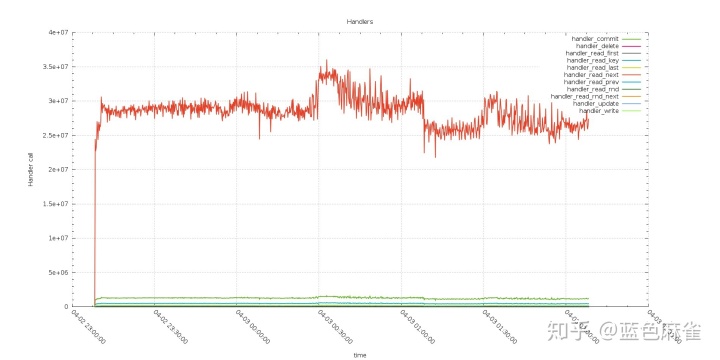
Aurora Handler calls:
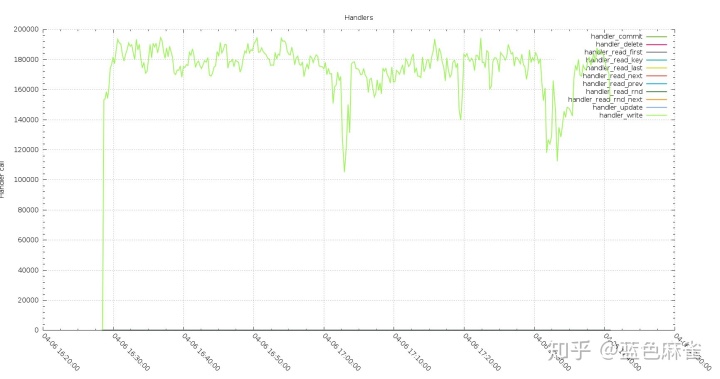
XtraDB Cluster Handlers:
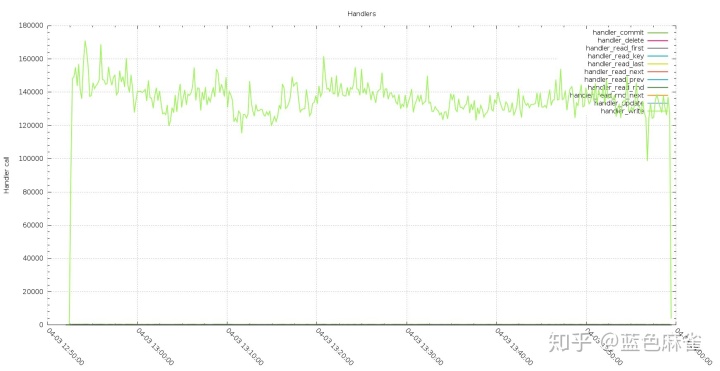
The execution in XtraDB Cluster showed fewer calls but constant performance, while Aurora has hiccups.
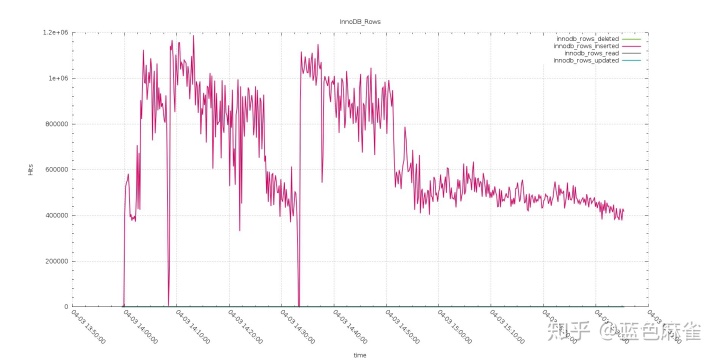
Aurora page activity write:
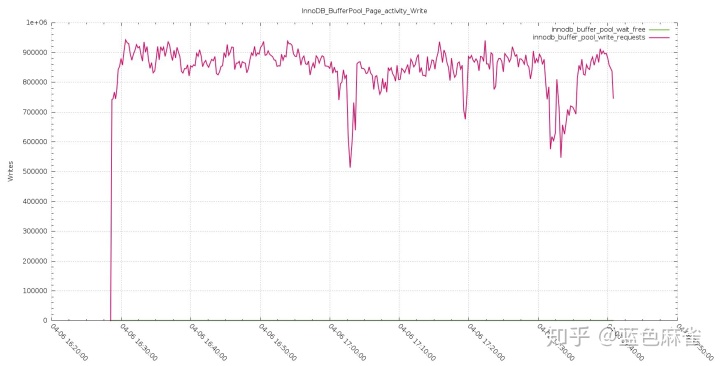
XtraDB Cluster page activity write:
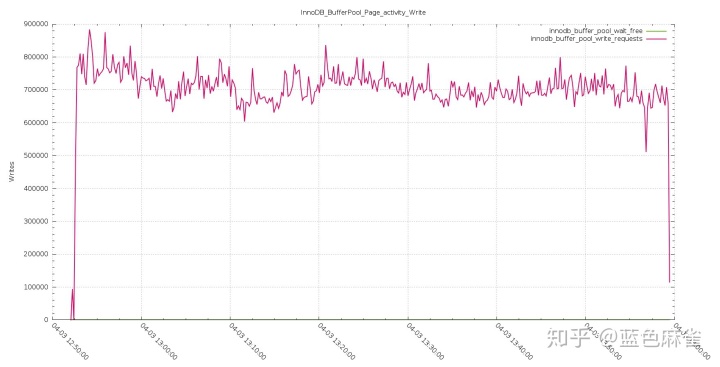
The trend shown by the handlers stayed consistent in the page management and rows insert, as expected.
Second Test: Application Ingest
As mentioned, this test showed many threads from different application servers, inserted by a batch of 50 statements against multiple tables.
The results coming from this test are quite favorable to Aurora, as we can see starting from the time taken to complete the same workload:
LB
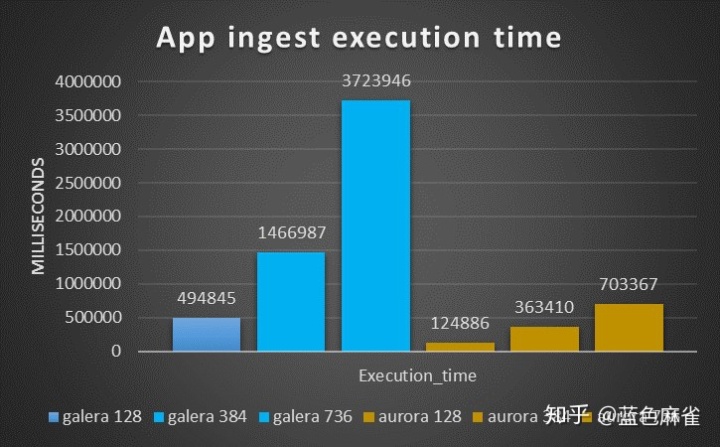
SB
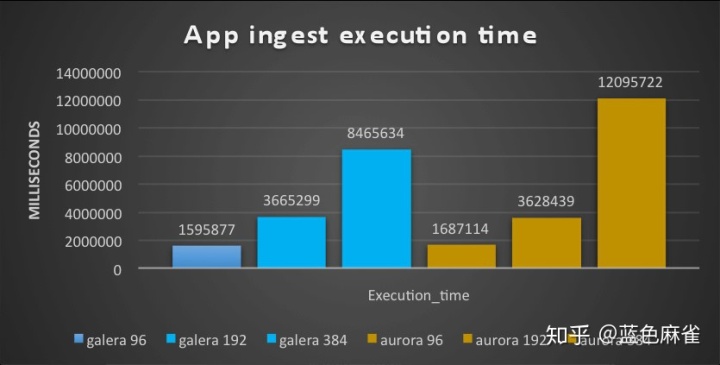
With small ones, the situation was inverted.
But here is where the interesting part starts.
Aurora can manage significantly higher numbers of rows, as the picture below shows:
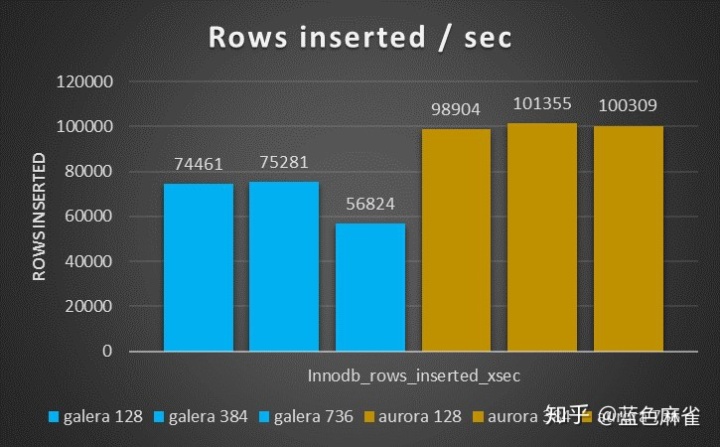
The results are also constant, and don’t decrease significantly like the inserts with XtraDB Cluster.
The number of handler commits, however, are significantly less.
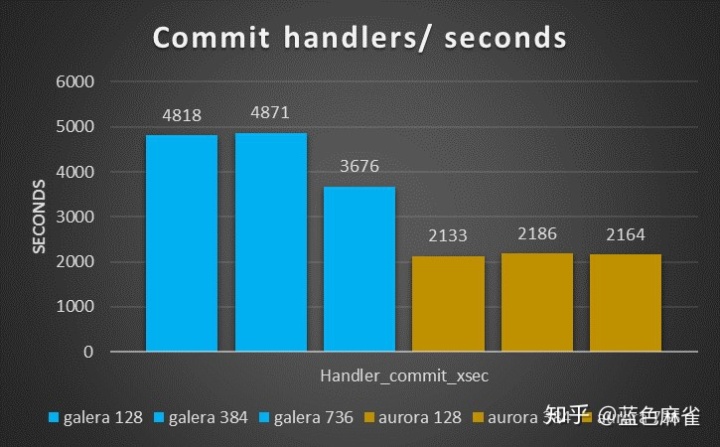
Once more they stay the same with the load increase, without impacting performance.
Reviewing all handler calls, we get our first surprise.
XtraDB Cluster handler calls:
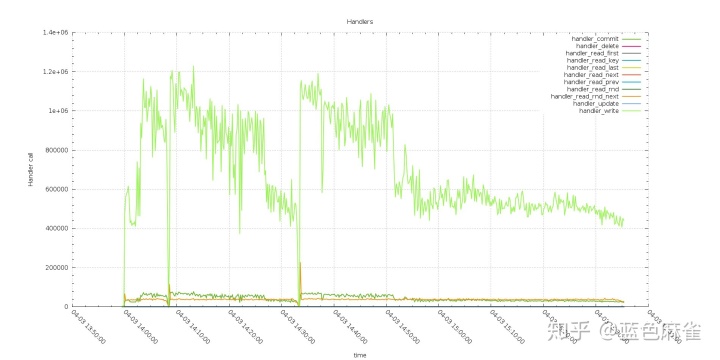
Aurora handler calls:
The gap/drop existing in the two graphs are the different tests (with an increasing number of threads).
Two things to notice here: the first one is that XtraDB Cluster decreases in performance while processing the load, while Aurora does not. The second (you need to zoom the image) is the number of commits is floating in XtraDB Cluster, while it stays fixed in Aurora.
An even bigger surprise comes up when reviewing the connections graphs.
As expected, XtraDB Cluster has all my connections open, and the number of threads running is quite close to the number of connected threads.
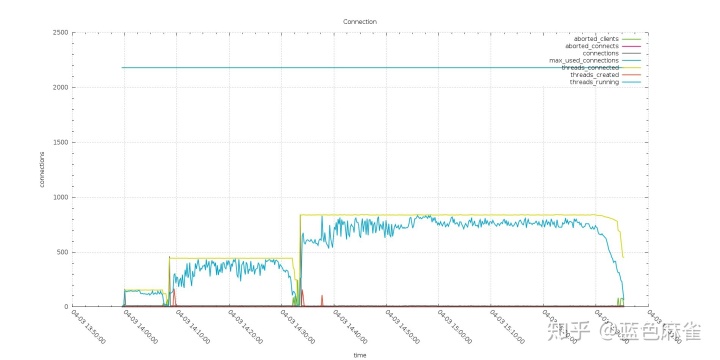
Both of them follow the increasing number of connected threads.
But this is not the case in Aurora.
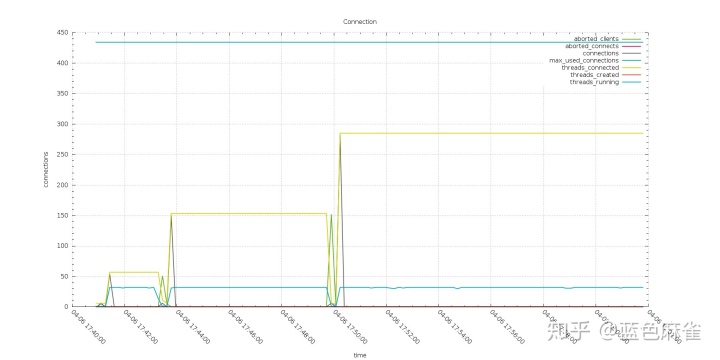
Also, if my applications are trying to open ~800 threads, the Aurora node sees only a part of them, and the number of running is fixed to 32 threads.
The important things to consider here are that a) my applications don’t connect directly to the Aurora instance, but to a connector (MariaDB), and b) that Aurora, in this case, caps the number of running threads to the number of CPU available on the instance (here 32).
Given that, I expected to have worse performance (but I don’t). The fact that Aurora uses one thread for multiple connections seems to be working quite efficiently.
The number of rows inserted is also consistent with the handler calls and has better performance than XtraDB Cluster.
Aurora rows inserted:
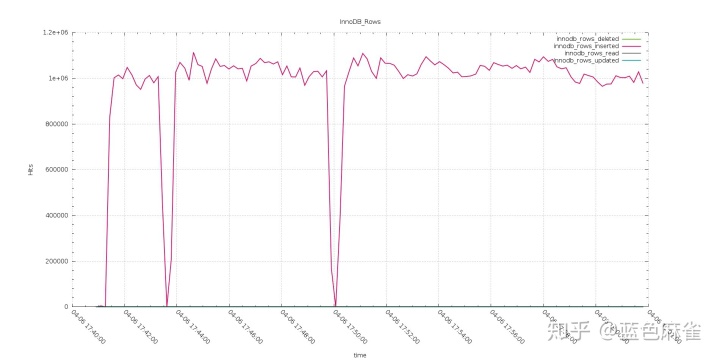
XtraDB Cluster rows inserted
Again we have the same trend, only, this time, Aurora performs better than XtraDB Cluster.
Third Test: OLTP Application
When running on the small boxes, this test saw XtraDB Cluster performing much better than Aurora. The time taken by Aurora was ~3 times the time taken by XtraDB Cluster.
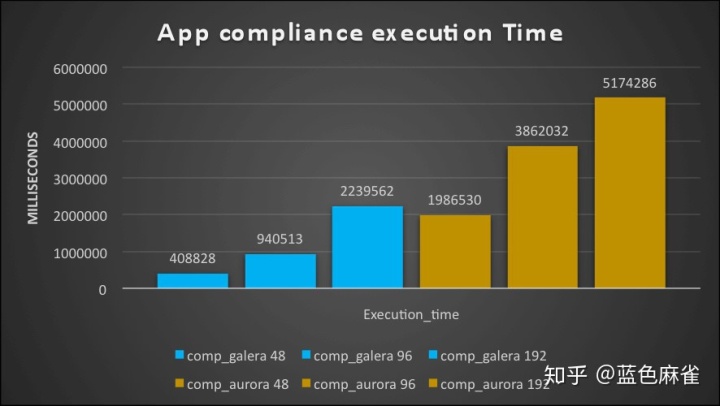
With a large box, I had the inverse result: Aurora is outperforming XtraDB Cluster from 2 to 7 times the speed.
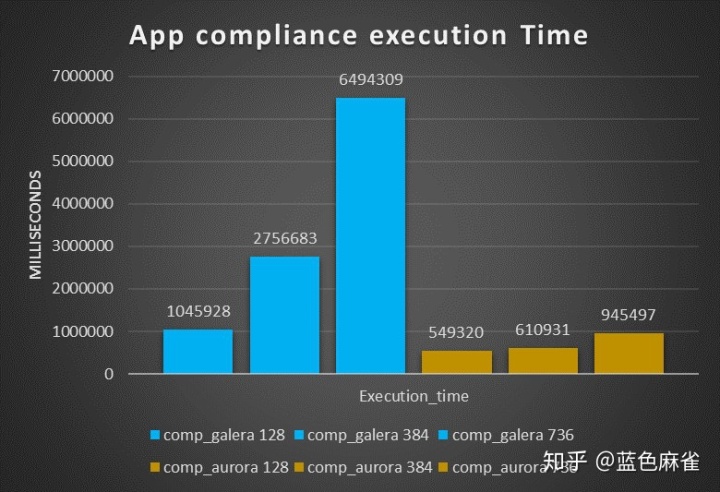
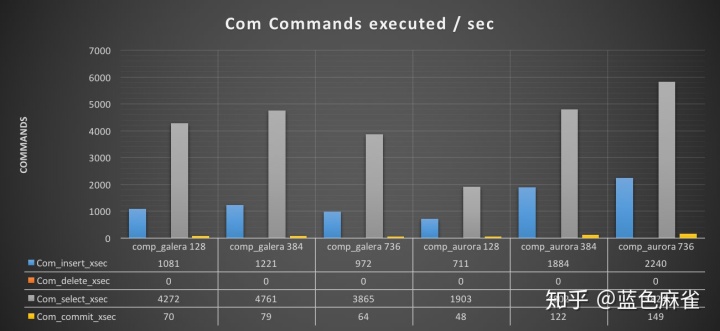
Analyzing the number of commands executed with the increasing workload, we can see how XtraDB Cluster can perform better than Aurora with a workload of 128 threads but starts to have worse performance as the load increases.
On the other hand, Aurora manages the read/write load without significant performance loss, which includes being able to increase the number of commits/sec.
Reviewing the handler calls, we see that the handler commit calls are significantly less in Aurora (as already noticed in the ingest tests).
Another thing to note is that the number of calls for XtraDB Cluster is significantly higher and not scaling, while Aurora has a nice scaling trend.
Fourth Test: TPCC-mysql
The TPCC test is mainly to test OLTP traffic, with the note that some tables (like district) might become a hotspot. The tests I ran were executed against 400 warehouses and used 128 threads maximum for the small box and 2048 threads for the large box.
During this test, I hit one of the Aurora limitations and I escalated it to the Aurora engineers (who are aware of the problem).
Small boxes:
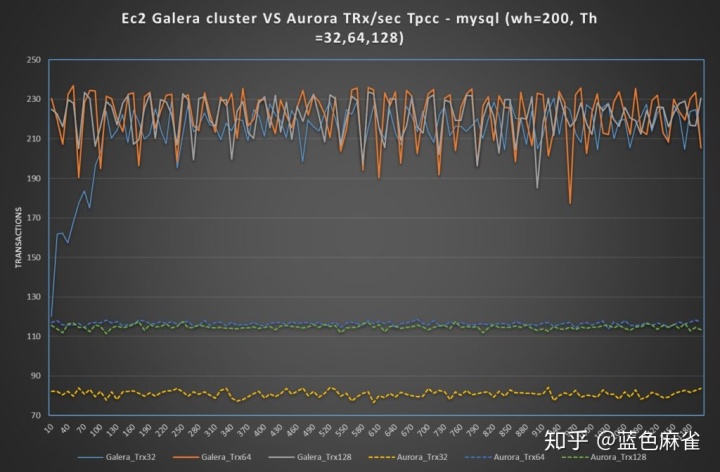
In the case of small boxes, there is nothing to say: XtraDB Cluster manages the load more efficiently. This trend is not optimal, having significant fluctuation. Aurora is just not able to keep it up.
Large boxes:
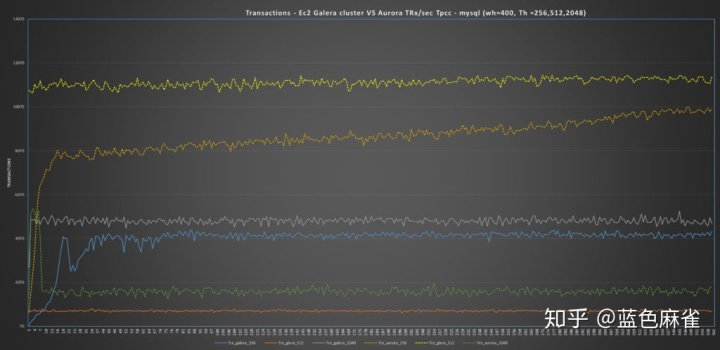
It is a different and a more complex scenario in the case of the use of large boxes. I would like to say that Aurora performs better.
This is true for two of the three tests, and up to when it got stuck by internal limitation Aurora was also performing better on the third. But then its performance just collapsed.
With a more in-depth investigation, I noticed that under the hood Aurora was not performing as well as it appeared. This comes out quite clearly by looking at a comparison between the graphs covering Comm_ execution, open files, handlers and InnoDBrow lock time.
In all of them, it is evident how XtraDB Cluster keeps serving the workload with consistent behavior, while Aurora fails the second test on (512 threads) — not just on the third with 2048 threads.
Aurora:
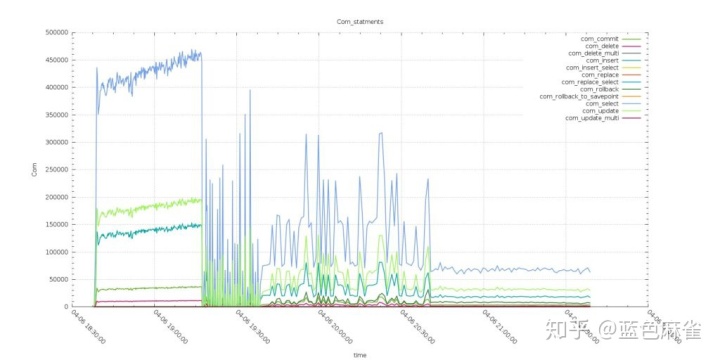
XtraDB Cluster:
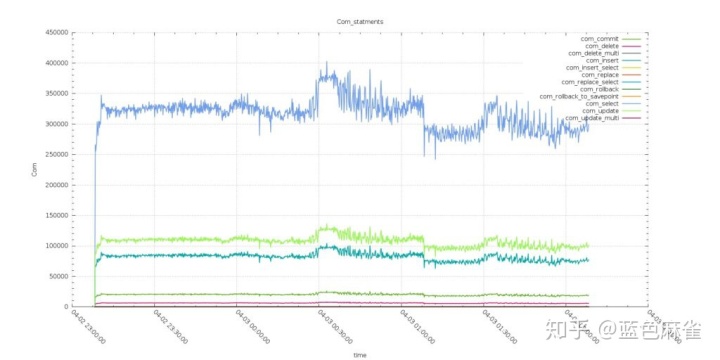
It is clear that Aurora was better served during the test with 256 threads going over the 450K com select serve (in 10 sec interval), compared with XtraDB Cluster that was not able to go over 350K.
But in the following tests, while XtraDB Cluster was able to keep going (with decreasing performance), Aurora started to struggle with very inconsistent behavior.
This was also confirmed by the open files graph.
Aurora:
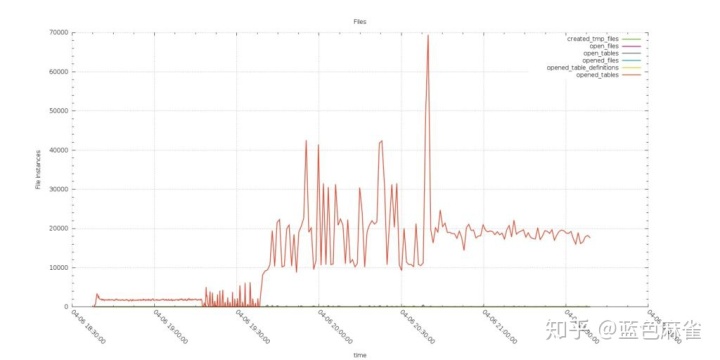
XtraDB Cluster:
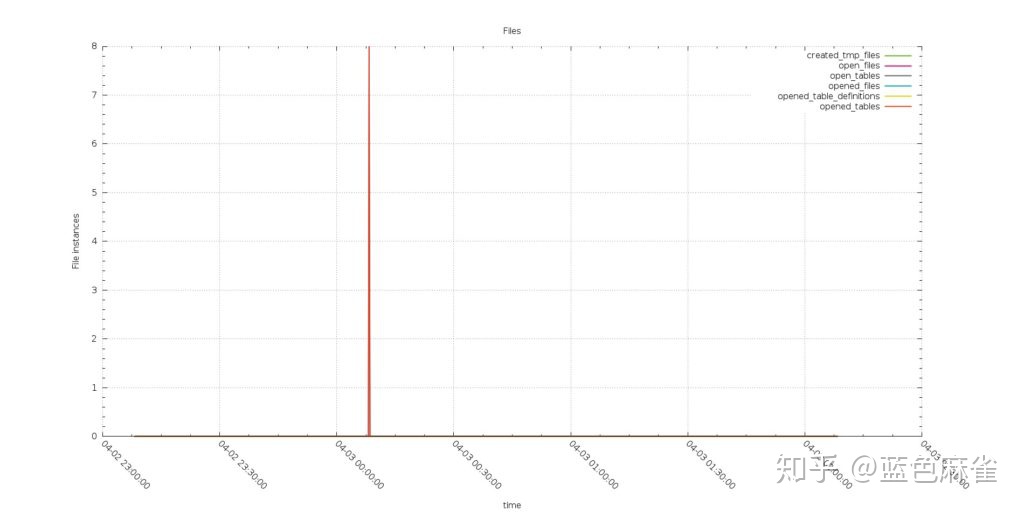
The graphs show the instances of files open during the test, not the ones already open. It reflects the Open_file metric “The number of files that are open. This count includes regular files opened by the server. It does not include other types of files such as sockets or pipes. Also, the count does not include files that storage engines open using their own internal functions rather than asking the server level to do so.”
I was quite surprised by the number of files open by Aurora.
Handlers reflected the same behavior, as well.
Aurora:
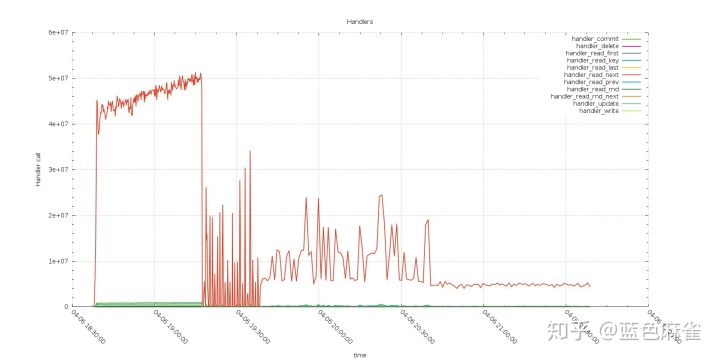
XtraDB Cluster:
Perfectly in line with the com trend.
So what was increasing in reverse?
Aurora:
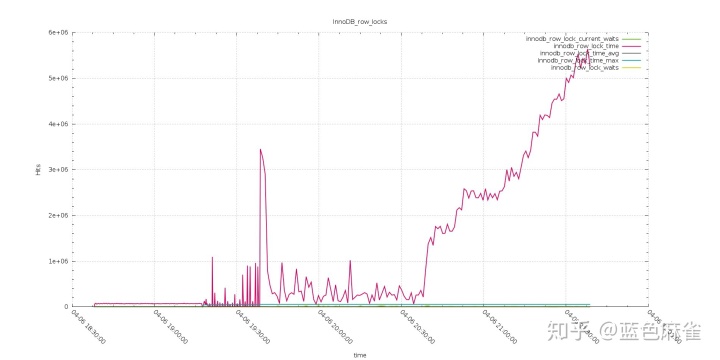
XtraDB Cluster:
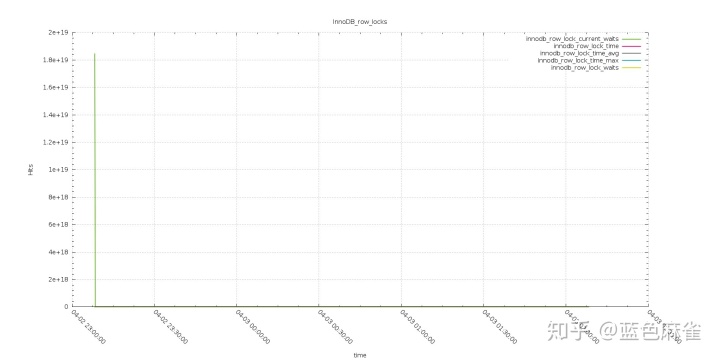
As you can see from the above, the exactly same workload generated an increasing lock row time, from quite low in the test with 256 threads, up to a crazy high with 2048 threads.
As mentioned, we know that TPCC has a couple of tables that act as hotspots, and we already saw with IIbench how Aurora is not working efficiently in that case.
I also was getting a lot of 188 errors during the test. This is an Aurora internal error. When I reported it, I was told they know about it, and they are planning to work on it.
I hope they do soon, because if this issue is solved it is very likely that Aurora will not only be able to manage the tested workload, but exceed it by far.
I am saying this because also with the identified issues Aurora was able to keep going and manage a more than decent response time during the second test (with 512 threads).
Fifth Test: Sysbench
I added the sysbench tests to test scalability, and to see the what happens when the system reaches a saturation point. This test brought up some limitations existing in the Aurora solution, related more to the connector than the Aurora engine itself.
Aurora has a limit of 16k connections. I wanted to see what happens if I got to saturation point or close to it. It doesn’t matter if this is a ridiculously high number or not.
What happened was that Aurora managed traffic up to 4K. The closer I got to the limit, however, the more I had a connectivity issue. At the end I had to run the test with 8K, 12K and 20K threads pointing directly to the Aurora instance, bypassing the connector that was not able to serve the traffic. After that, I was able to hit up to ~15500 threads (but with a lot of inconsistent performance). I am defining the limit of a meaningful test from the previous level of 12K threads.
XtraDB Cluster was able to scale up to 16K no problem.
What also is notable here is that Aurora was able to manage the workload more efficiently regarding transaction handling (i.e., as transactions executed and latency).
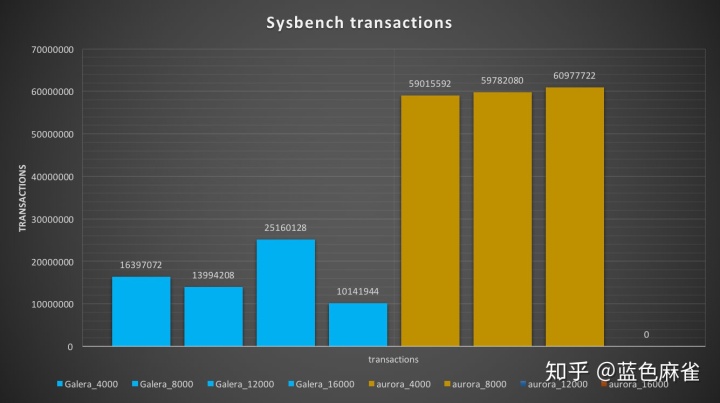
The number of transactions executed by Aurora was ~three times the one executed by XtraDB Cluster.
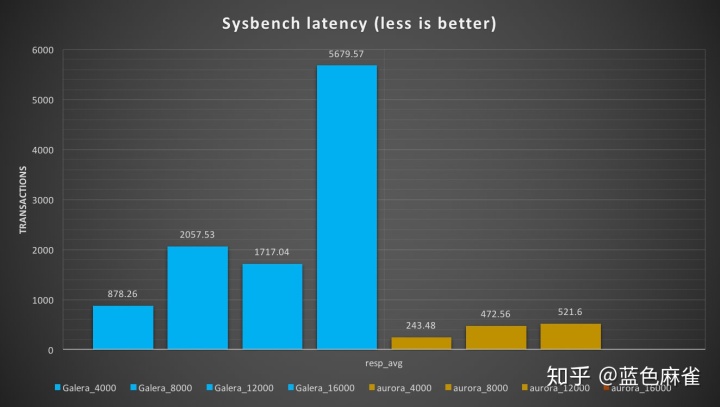
Regarding latency, Aurora showed less latency then XtraDB Cluster.
Internally, Aurora and XtraDB Cluster operations were once again different regarding how the workload was handled. The most divergent result was the handler calls:
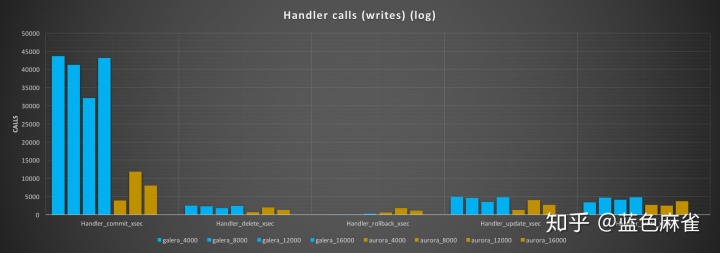
Commit calls in Aurora were a fraction of the calls in XtraDB Cluster, while the number of rollbacks was higher.
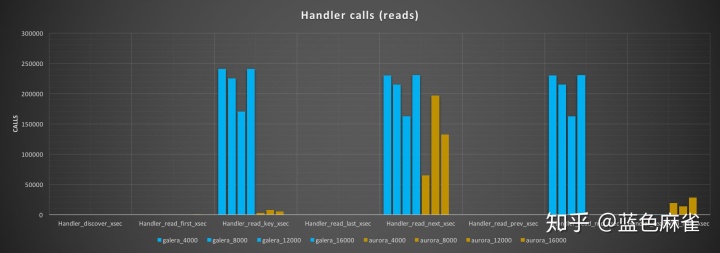
The read calls had an even more divergent behavior, with XtraDB Cluster performing a higher number of read_keys, while Aurora was having a very limited number of them. Read_rnd are very high in XtraDB Cluster, but totally absent in Aurora (note that in Aurora, read_rnds are reported but seem not to increase). On the other hand, Aurora reported a high number of read_rnd_next, while XtraDB Cluster has none.
HA availability
Fail-over time
Both solutions:
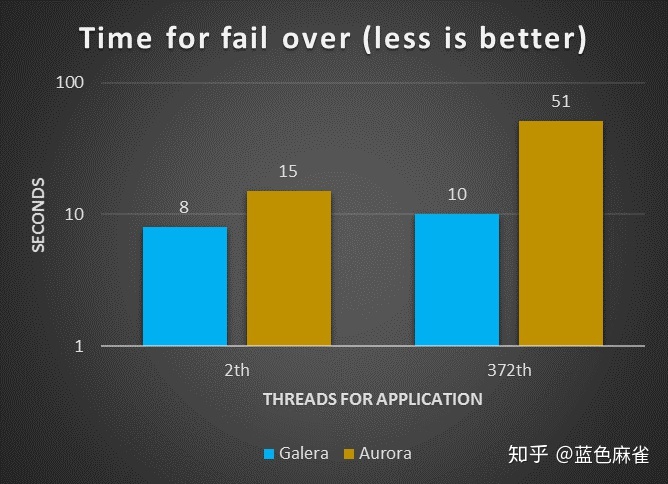
In this test, the fail-over time for the solution using Galera and HAProxy was more efficient. For both a limited or mid-level load. One assumption is that given Aurora has to verify both the status of the data transmitted and its consistency across the six data store nodes in every case; the process is not as fast as it could be.
It could also be that the cluster connector is not as efficient as it should in redirecting the traffic from one node to another. It would be a very interesting exercise to replace it with some other custom solution.
Note that I was performing the tests following the Amazon recommendation to use the following to simulate a real crash:
ALTER SYSTEM CRASH [INSTANCE|NODE]
As such, I was not doing anything strange or out of the ordinary.
It is worth mentioning that of the eight seconds taken by MySQL/Galera to perform the failover, six were due to the HAProxy settings (which had a 3000 ms interval and two loops in the settings before executing failover).
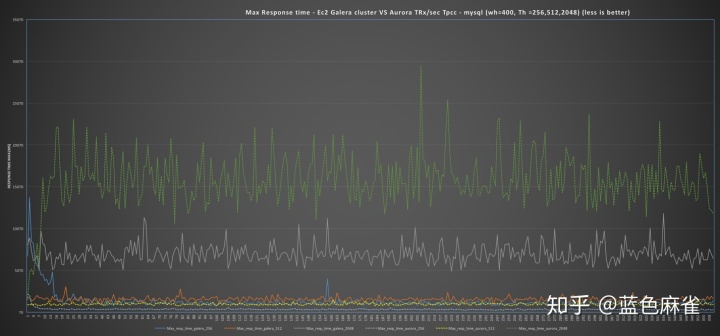
Execution latency
The purpose of these tests was to identify the latency existing between the moment that application sends the request and the moment MySQL/Aurora took the request in “charge”. The expectation is that the busier the database, the higher the latency.
For this test, I reported both results: the one coming from the old tests with the small box, and the new one with the large box.
Small boxes:
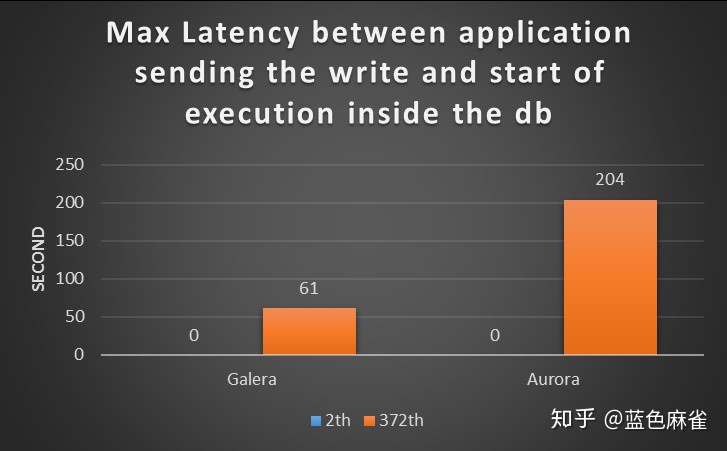
Large boxes:
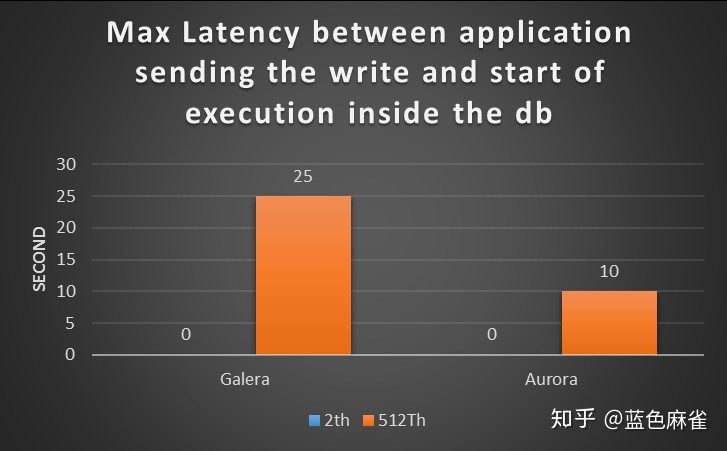
It is clear from the graphs that the two tests report different scenarios. In the first, Galera was able to manage the load more efficiently and serve requests with lower latency. For the new tests, I had used a higher number of threads than the ones for the small box. Nevertheless, in the second test the CPU utilization and the number of running threads lead me to think that Aurora was finally able to utilize resources more efficiently and the lower latency.
The latency jumped up again when the number of connections rose above 12K, but that was expected given previous tests results.
Conclusions
High Availability
The two platforms were able to manage the failover operation in a limited time frame (below 1 minute). Nevertheless, MySQL/Galera was shown to be more efficient and consistent. This result is a direct consequence of synchronous replication, which by design prevents MySQL/Galera from allowing an active node to fall behind.
In my opinion, the replication method used in Aurora is efficient, and given that data is shared across the read replicas, fail-over should happen faster.
The tests suffered because of the connector, and I have the feeling that having another solution in place may bring some surprises (actually, I would like to test that as well).
Performance
In this run of tests, Aurora was able to invert the results I had in the first test with the small boxes. In almost all cases, Aurora performed as well or better then XtraDB Cluster. There are still cases where Aurora is penalized, and those are the ones where hotspots are present. The contention in Aurora is killing performance, and raise errors (188). But I hope we will see a significant evolution soon.
General Comments on Aurora
The product is evolving quickly, and benchmark results may become obsolete in very short time (this is why it is important to have repeatable and comparable tests). From my point of view, in this set of tests Aurora clearly shows where it’s a better fit: higher-end levels, where high availability and CPU power is the focus (not concerns about the cost).
There is no reason to use Aurora in small-mid boxes: the platform is not going to be as efficient as a standard solution like XtraDB Cluster. But if cost is not an issue, and the applications require a lot of parallelism, Aurora on db.r3.8xlarge is a good solution.
I still see space for improvements (like for cluster connectors, or the time taken to restart a cluster after a full stop, or contention reduction). But I am also confident that the work led by the development team will fix most of my concerns (and more) soon.
Final note: it would be nice to have the code open source, so that the community could contribute (but I understand the business reasons not to).
About Cost
I don’t think it is this the right place to mention the cost of each solution (especially because each need is different).
As such, I am not reporting any specific numbers. You can, however, follow the links below and do the necessary math:


 969
969


 被折叠的 条评论
为什么被折叠?
被折叠的 条评论
为什么被折叠?
 到【灌水乐园】发言


