


学习笔记:(直接将jupyter notebook上的搬上来了哈哈)
假设现在我们有一组从2006年到2016年1000部最流行的电影数据,我们想知道这些电影中评分的平均分,导演的人数等信息,我们该怎么获取?
对于一组电影数据,如果我们希望统计电影分类的情况,该如何处理数据?
数据来源于kaggle
import pandas as pdfilt_path = "../data/IMDB-Movie-Data.csv"df = pd.read_csv(filt_path)# 查看数据信息df.info()df.head(1)
RangeIndex: 1000 entries, 0 to 999
Data columns (total 12 columns):
 #   Column              Non-Null Count  Dtype
---  ------              --------------  -----
 0   Rank                1000 non-null   int64
 1   Title               1000 non-null   object
 2   Genre               1000 non-null   object
 3   Description         1000 non-null   object
 4   Director            1000 non-null   object
 5   Actors              1000 non-null   object
 6   Year                1000 non-null   int64
 7   Runtime (Minutes)   1000 non-null   int64
 8   Rating              1000 non-null   float64
 9   Votes               1000 non-null   int64
 10  Revenue (Millions)  872 non-null    float64
 11  Metascore           936 non-null    float64
dtypes: float64(3), int64(4), object(5)
memory usage: 93.9+ KB
# 获取电影的平均评分df["Rating"].mean()6.723199999999999# 导演人数len(set(df["Director"].tolist()))644# 获取导演人数方式二len(df["Director"].unique())import numpy as np# 获取演员人数temp_actors_list = df["Actors"].str.split(",").tolist()actors_list = [i for j in temp_actors_list for i in j] # 用列表推导式组合成一个列表actors_num = len(set(actors_list))print(actors_num)2394# 获取电影时长的最大值最小值max_runtime = df["Runtime (Minutes)"].max()max_runtime_index = df["Runtime (Minutes)"].argmax()min_runtime = df["Runtime (Minutes)"].min()min_runtime_index = df["Runtime (Minutes)"].argmin()runtime_median = df["Runtime (Minutes)"].median()print(max_runtime)print(max_runtime_index)print(min_runtime)print(min_runtime_index)print(runtime_median)191
828
66
793
111.0df.head(1)
# 统计电影的分类数据# 思路:重新构造一个全为0的数组,列名为分类,如果某一条数据中分类出现过,就让0变为1# 查看目标字段的情况df["Genre"]0 Action,Adventure,Sci-Fi
1 Adventure,Mystery,Sci-Fi
2 Horror,Thriller
3 Animation,Comedy,Family
4 Action,Adventure,Fantasy
...
995 Crime,Drama,Mystery
996 Horror
997 Drama,Music,Romance
998 Adventure,Comedy
999 Comedy,Family,Fantasy
Name: Genre, Length: 1000, dtype: objectimport numpy as np# 统计分类的列表temp_list = df["Genre"].str.split(",").tolist() # 这里数据呈现这种形式:[[],[],[],...]# 需要将上面的数据形式展开,用set结合for循环来展开,set是集合的方法,而集合中数据具有唯一性genre_list = list(set([i for j in temp_list for i in j]))# 构造全为0的数组zero_df = pd.DataFrame(np.zeros((df.shape[0],len(genre_list))), columns=genre_list)zero_df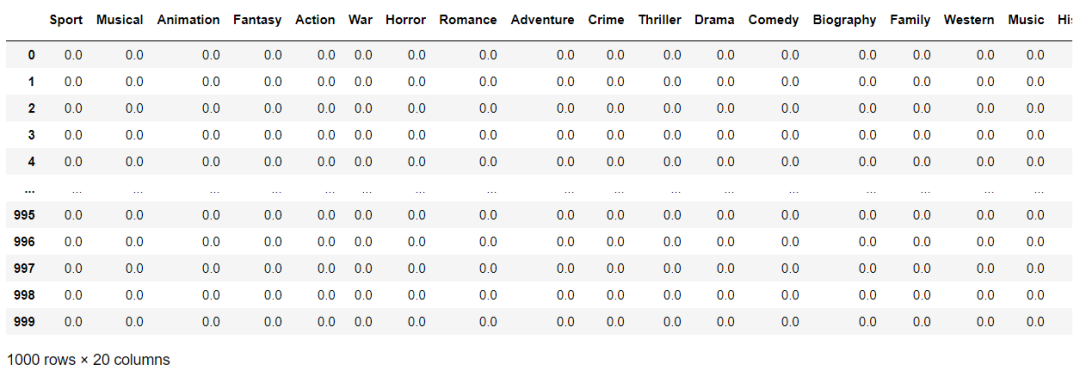
# temp_list的数据情况:每一个电影的分类情况temp_listdf.shape[0]1000# 未执行循环前的值zero_df.loc[0,temp_list[0]]Action 0.0
Adventure 0.0
Sci-Fi 0.0
Name: 0, dtype: float64# 给每个电影出现分类的位置赋值for i in range(df.shape[0]): # 当i=0的时候,下面的展现是:zero_df.loc[0, ['Action', 'Adventure', 'Sci-Fi']] = 1 表示,将第1行所对应的那三个列索引处的值都赋值为1 zero_df.loc[i,temp_list[i]] = 1 zero_df.head(5)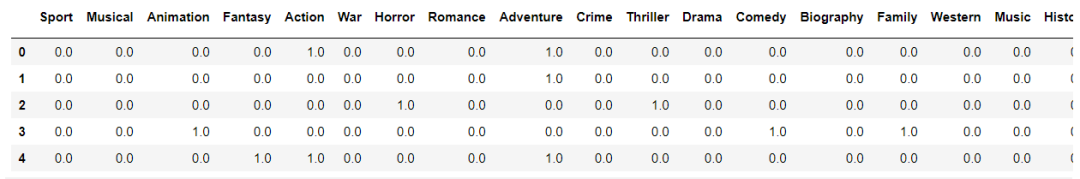
# 执行循环后的值,赋值为了1,数组的赋值特性,这里的temp_list[0]出来的值是作为它的列索引zero_df.loc[0,temp_list[0]]Action 1.0
Adventure 1.0
Sci-Fi 1.0
Name: 0, dtype: float64# 统计每个分类电影的数量和genre_count = zero_df.sum(axis=0)genre_countSport 18.0
Musical 5.0
Animation 49.0
Fantasy 101.0
Action 303.0
War 13.0
Horror 119.0
Romance 141.0
Adventure 259.0
Crime 150.0
Thriller 195.0
Drama 513.0
Comedy 279.0
Biography 81.0
Family 51.0
Western 7.0
Music 16.0
History 29.0
Mystery 106.0
Sci-Fi 120.0
dtype: float64# 排序genre_count = genre_count.sort_values()from matplotlib import pyplot as plt_x = genre_count.index_y = genre_count.values# 画图plt.figure(figsize=(20,8), dpi=80)plt.bar(range(len(_x)), _y, width=0.4, color="orange")plt.xticks(range(len(_x)), _x)plt.show()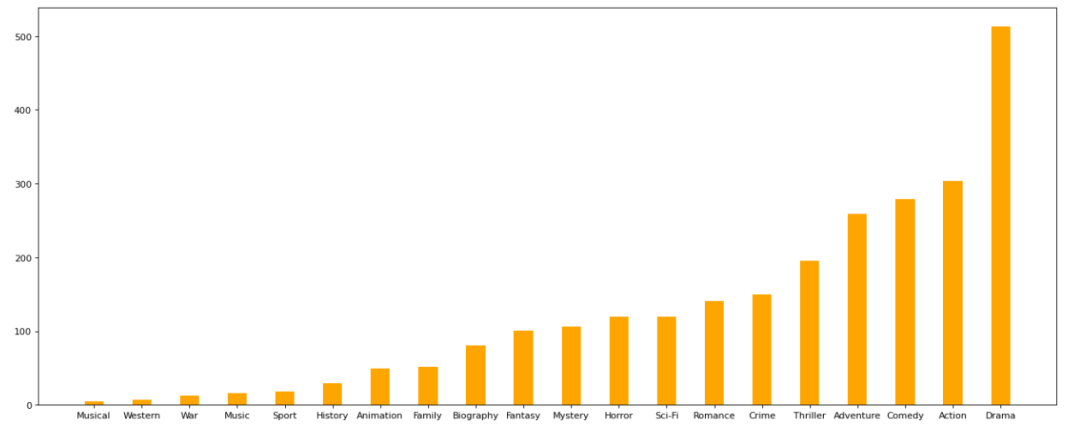


 620
620


 被折叠的 条评论
为什么被折叠?
被折叠的 条评论
为什么被折叠?
 到【灌水乐园】发言


