


1.timeit: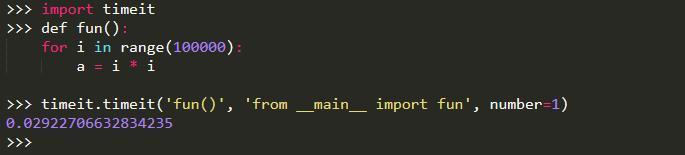
timeit只输出被测试代码的总运行时间
单位为秒,没有详细的统计。
2.profileprofile:纯Python实现的性能测试模块,接口和cProfile一样。
ncall:函数运行次数
tottime: 函数的总的运行时间,减去函数中调用子函数的运行时间
第一个percall:percall = tottime / nclallcumtime:函数及其所有子函数调整的运行时间,也就是函数开始调用到结束的时间。
第二个percall:percall = cumtime / nclall
3.cProfileprofile:c语言实现的性能测试模块,接口和profile一样。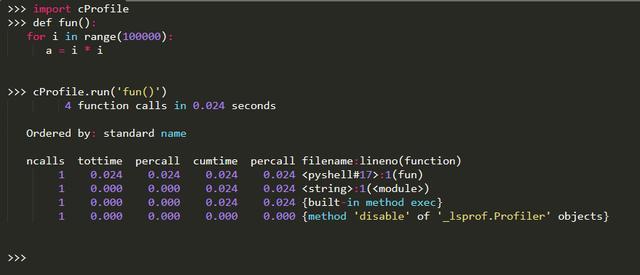
ncalls、tottime、percall、cumtime含义同profile。
4.line_profiler
安装:pip install line_profiler
安装之后kernprof.py会加到环境变量中。
line_profiler可以统计每行代码的执行次数和执行时间等,时间单位为微妙。
测试代码:
C:Python34 est.py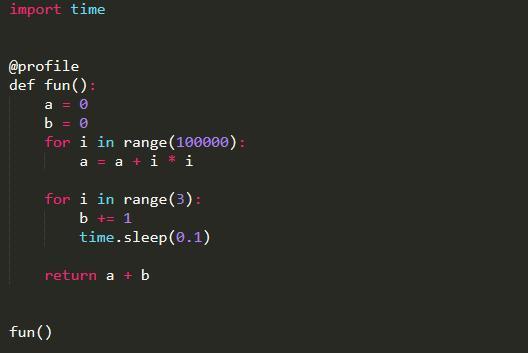
使用:在需要测试的函数加上@profile装饰,这里我们把测试代码写在C:Python34 est.py文件上.
运行命令行:kernprof -l -v C:Python34 est.py
输出结果如下:
Total Time:测试代码的总运行时间
Hits:表示每行代码运行的次数
Time:每行代码运行的总时间
Per Hits:每行代码运行一次的时间
% Time:每行代码运行时间的百分比
5.memory_profiler:memory_profiler工具可以统计每行代码占用的内存大小。
安装:pip install memory_profiler
pip install psutil
测试代码:
同line_profiler。
使用:在需要测试的函数加上@profile装饰
执行命令: python -m memory_profiler C:Python34 est.py
输出如下: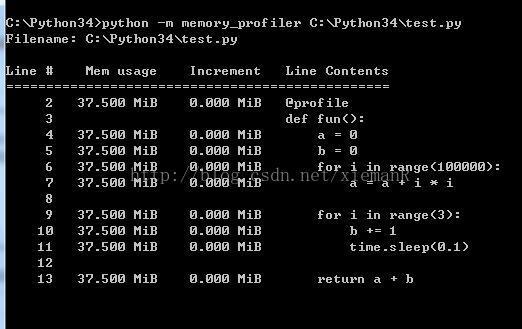
6.PyCharm图形化性能测试工具:PyCharm提供了图像化的性能分析工具,使用方法见官网
7.objgraph:objgraph是一个实用模块,可以列出当前内存中存在的对象,可用于定位内存泄露。
objgraph需要安装:pip install objgraph
如果你想更多的了解Python,点击以下视频跳转链接:


 590
590


 被折叠的 条评论
为什么被折叠?
被折叠的 条评论
为什么被折叠?
 到【灌水乐园】发言


