


我们在Kafka实战1-全家桶安装中使用Strimzi在K8S上安装了Kafka全家桶,本节我们将使用Strimzi来实现对Kafka集群的监控。
在Strimzi提供的监控方案主要有Prometheus JMX Exporter和Strimzi Kafka Exporter,使用Prometheus将这些指标数据(metrics)读取,然后通过Grafana将Prometheus作为数据源展示出来作为监控。
Strimizi源码可在此页面选择最新版本下载:https://strimzi.io/downloads/,Strimizi源码本例0.19.0版本下载地址:https://github.com/strimzi/strimzi-kafka-operator/releases/download/0.19.0/strimzi-0.19.0.zip

1.Prometheus JMX Exporter
1.1 更新部署Kafka集群
1.1.1 更新部署Kafka集群metrics配置
- 参考例子strimzi-0.19.0/examples/metrics/kafka-metrics.yaml,为我们前面部署的kafka-persistent.yml添加metrics配置:
apiVersion: kafka.strimzi.io/v1beta1kind: Kafkametadata: name: my-clusterspec: kafka: version: 2.5.0 replicas: 3 listeners: plain: {} tls: {} config: offsets.topic.replication.factor: 3 transaction.state.log.replication.factor: 3 delete.topic.enable: "true" transaction.state.log.min.isr: 2 log.message.format.version: "2.5" storage: type: jbod volumes: - id: 0 type: persistent-claim size: 100Gi deleteClaim: false class: fast metrics: # Inspired by config from Kafka 2.0.0 example rules: # https://github.com/prometheus/jmx_exporter/blob/master/example_configs/kafka-2_0_0.yml lowercaseOutputName: true rules: # Special cases and very specific rules - pattern : kafka.server<>Value name: kafka_server_$1_$2 type: GAUGE labels: clientId: "$3" topic: "$4" partition: "$5" - pattern : kafka.server<>Value name: kafka_server_$1_$2 type: GAUGE labels: clientId: "$3" broker: "$4:$5" # Some percent metrics use MeanRate attribute # Ex) kafka.server<>MeanRate - pattern: kafka.(w+)<>MeanRate name: kafka_$1_$2_$3_percent type: GAUGE # Generic gauges for percents - pattern: kafka.(w+)<>Value name: kafka_$1_$2_$3_percent type: GAUGE - pattern: kafka.(w+)<>Value name: kafka_$1_$2_$3_percent type: GAUGE labels: "$4": "$5" # Generic per-second counters with 0-2 key/value pairs - pattern: kafka.(w+)<>Count name: kafka_$1_$2_$3_total type: COUNTER labels: "$4": "$5" "$6": "$7" - pattern: kafka.(w+)<>Count name: kafka_$1_$2_$3_total type: COUNTER labels: "$4": "$5" - pattern: kafka.(w+)<>Count name: kafka_$1_$2_$3_total type: COUNTER # Generic gauges with 0-2 key/value pairs - pattern: kafka.(w+)<>Value name: kafka_$1_$2_$3 type: GAUGE labels: "$4": "$5" "$6": "$7" - pattern: kafka.(w+)<>Value name: kafka_$1_$2_$3 type: GAUGE labels: "$4": "$5" - pattern: kafka.(w+)<>Value name: kafka_$1_$2_$3 type: GAUGE # Emulate Prometheus 'Summary' metrics for the exported 'Histogram's. # Note that these are missing the '_sum' metric! - pattern: kafka.(w+)<>Count name: kafka_$1_$2_$3_count type: COUNTER labels: "$4": "$5" "$6": "$7" - pattern: kafka.(w+)<>(d+)thPercentile name: kafka_$1_$2_$3 type: GAUGE labels: "$4": "$5" "$6": "$7" quantile: "0.$8" - pattern: kafka.(w+)<>Count name: kafka_$1_$2_$3_count type: COUNTER labels: "$4": "$5" - pattern: kafka.(w+)<>(d+)thPercentile name: kafka_$1_$2_$3 type: GAUGE labels: "$4": "$5" quantile: "0.$6" - pattern: kafka.(w+)<>Count name: kafka_$1_$2_$3_count type: COUNTER - pattern: kafka.(w+)<>(d+)thPercentile name: kafka_$1_$2_$3 type: GAUGE labels: quantile: "0.$4" zookeeper: replicas: 3 storage: type: persistent-claim size: 100Gi deleteClaim: false class: fast metrics: # Inspired by Zookeeper rules # https://github.com/prometheus/jmx_exporter/blob/master/example_configs/zookeeper.yaml lowercaseOutputName: true rules: # replicated Zookeeper - pattern: "org.apache.ZooKeeperService<>(w+)" name: "zookeeper_$2" type: GAUGE - pattern: "org.apache.ZooKeeperService<>(w+)" name: "zookeeper_$3" type: GAUGE labels: replicaId: "$2" - pattern: "org.apache.ZooKeeperService<>(Packetsw+)" name: "zookeeper_$4" type: COUNTER labels: replicaId: "$2" memberType: "$3" - pattern: "org.apache.ZooKeeperService<>(w+)" name: "zookeeper_$4" type: GAUGE labels: replicaId: "$2" memberType: "$3" - pattern: "org.apache.ZooKeeperService<>(w+)" name: "zookeeper_$4_$5" type: GAUGE labels: replicaId: "$2" memberType: "$3" # standalone Zookeeper - pattern: "org.apache.ZooKeeperService<>(w+)" type: GAUGE name: "zookeeper_$2" - pattern: "org.apache.ZooKeeperService<>(w+)" type: GAUGE name: "zookeeper_$2" entityOperator: topicOperator: {} userOperator: {}- 更新部署
kubectl apply -f kafka-persistent.yml -n kafka1.1.2 更新部署Kafka Connect集群metrics配置
- 根据strimzi-0.19.0/examples/metrics/kafka-connect-metrics.yaml修改kafka-connect.yaml,增加metrics配置:
apiVersion: kafka.strimzi.io/v1beta1kind: KafkaConnectmetadata: name: my-connect-cluster# annotations:# # use-connector-resources configures this KafkaConnect# # to use KafkaConnector resources to avoid# # needing to call the Connect REST API directly# strimzi.io/use-connector-resources: "true"spec: version: 2.5.0 replicas: 1 bootstrapServers: my-cluster-kafka-bootstrap:9093 image: registry.cn-shanghai.aliyuncs.com/wiselyman/kafka-connect-mysql-es:4 tls: trustedCertificates: - secretName: my-cluster-cluster-ca-cert certificate: ca.crt config: group.id: connect-cluster offset.storage.topic: connect-cluster-offsets config.storage.topic: connect-cluster-configs status.storage.topic: connect-cluster-status schema.registry.url: http://my-cluster-kafka-schema-registry-cp-schema-registry:8081 key.converter: org.apache.kafka.connect.storage.StringConverter value.converter: io.confluent.connect.avro.AvroConverter value.converter.schema.registry.url: http://my-cluster-kafka-schema-registry-cp-schema-registry:8081 metrics: # Inspired by kafka-connect rules # https://github.com/prometheus/jmx_exporter/blob/master/example_configs/kafka-connect.yml lowercaseOutputName: true lowercaseOutputLabelNames: true rules: #kafka.connect:type=app-info,client-id="{clientid}" #kafka.consumer:type=app-info,client-id="{clientid}" #kafka.producer:type=app-info,client-id="{clientid}" - pattern: 'kafka.(.+)<>start-time-ms' name: kafka_$1_start_time_seconds labels: clientId: "$2" help: "Kafka $1 JMX metric start time seconds" type: GAUGE valueFactor: 0.001 - pattern: 'kafka.(.+)<>(commit-id|version): (.+)' name: kafka_$1_$3_info value: 1 labels: clientId: "$2" $3: "$4" help: "Kafka $1 JMX metric info version and commit-id" type: GAUGE #kafka.producer:type=producer-topic-metrics,client-id="{clientid}",topic="{topic}"", partition="{partition}" #kafka.consumer:type=consumer-fetch-manager-metrics,client-id="{clientid}",topic="{topic}"", partition="{partition}" - pattern: kafka.(.+)<>(.+-total|compression-rate|.+-avg|.+-replica|.+-lag|.+-lead) name: kafka_$2_$6 labels: clientId: "$3" topic: "$4" partition: "$5" help: "Kafka $1 JMX metric type $2" type: GAUGE #kafka.producer:type=producer-topic-metrics,client-id="{clientid}",topic="{topic}" #kafka.consumer:type=consumer-fetch-manager-metrics,client-id="{clientid}",topic="{topic}"", partition="{partition}" - pattern: kafka.(.+)<>(.+-total|compression-rate|.+-avg) name: kafka_$2_$5 labels: clientId: "$3" topic: "$4" help: "Kafka $1 JMX metric type $2" type: GAUGE #kafka.connect:type=connect-node-metrics,client-id="{clientid}",node-id="{nodeid}" #kafka.consumer:type=consumer-node-metrics,client-id=consumer-1,node-id="{nodeid}" - pattern: kafka.(.+)<>(.+-total|.+-avg) name: kafka_$2_$5 labels: clientId: "$3" nodeId: "$4" help: "Kafka $1 JMX metric type $2" type: UNTYPED #kafka.connect:type=kafka-metrics-count,client-id="{clientid}" #kafka.consumer:type=consumer-fetch-manager-metrics,client-id="{clientid}" #kafka.consumer:type=consumer-coordinator-metrics,client-id="{clientid}" #kafka.consumer:type=consumer-metrics,client-id="{clientid}" - pattern: kafka.(.+)<>(.+-total|.+-avg|.+-bytes|.+-count|.+-ratio|.+-age|.+-flight|.+-threads|.+-connectors|.+-tasks|.+-ago) name: kafka_$2_$4 labels: clientId: "$3" help: "Kafka $1 JMX metric type $2" type: GAUGE #kafka.connect:type=connector-task-metrics,connector="{connector}",task="{task}<> status" - pattern: 'kafka.connect<>status: ([a-z-]+)' name: kafka_connect_connector_status value: 1 labels: connector: "$1" task: "$2" status: "$3" help: "Kafka Connect JMX Connector status" type: GAUGE #kafka.connect:type=task-error-metrics,connector="{connector}",task="{task}" #kafka.connect:type=source-task-metrics,connector="{connector}",task="{task}" #kafka.connect:type=sink-task-metrics,connector="{connector}",task="{task}" #kafka.connect:type=connector-task-metrics,connector="{connector}",task="{task}" - pattern: kafka.connect<>(.+-total|.+-count|.+-ms|.+-ratio|.+-avg|.+-failures|.+-requests|.+-timestamp|.+-logged|.+-errors|.+-retries|.+-skipped) name: kafka_connect_$1_$4 labels: connector: "$2" task: "$3" help: "Kafka Connect JMX metric type $1" type: GAUGE #kafka.connect:type=connector-metrics,connector="{connector}" #kafka.connect:type=connect-worker-metrics,connector="{connector}" - pattern: kafka.connect<>([a-z-]+) name: kafka_connect_worker_$2 labels: connector: "$1" help: "Kafka Connect JMX metric $1" type: GAUGE #kafka.connect:type=connect-worker-metrics - pattern: kafka.connect<>([a-z-]+) name: kafka_connect_worker_$1 help: "Kafka Connect JMX metric worker" type: GAUGE #kafka.connect:type=connect-worker-rebalance-metrics - pattern: kafka.connect<>([a-z-]+) name: kafka_connect_worker_rebalance_$1 help: "Kafka Connect JMX metric rebalance information" type: GAUGE- 更新部署
kubectl apply -f kafka-connect.yml -n kafka1.2 配置安装Promethueus
1.2.1 安装Promethueus Operator
- 安装Promethueus Operator,地址:https://operatorhub.io/operator/prometheus
kubectl create -f https://operatorhub.io/install/prometheus.yamlkubectl get csv -n operators1.2.2 配置安装Promethueus Server
- 对于目录strimzi-0.19.0/examples/metrics/prometheus-install的文件。
- prometheus.yaml:namespace修改为default,Promethueus将安装到default命名空间
apiVersion: rbac.authorization.k8s.io/v1kind: ClusterRolemetadata: name: prometheus-server labels: app: strimzirules: - apiGroups: [""] resources: - nodes - nodes/proxy - services - endpoints - pods verbs: ["get", "list", "watch"] - apiGroups: - extensions resources: - ingresses verbs: ["get", "list", "watch"] - nonResourceURLs: ["/metrics"] verbs: ["get"]---apiVersion: v1kind: ServiceAccountmetadata: name: prometheus-server labels: app: strimzi---apiVersion: rbac.authorization.k8s.io/v1kind: ClusterRoleBindingmetadata: name: prometheus-server labels: app: strimziroleRef: apiGroup: rbac.authorization.k8s.io kind: ClusterRole name: prometheus-serversubjects: - kind: ServiceAccount name: prometheus-server namespace: default---apiVersion: monitoring.coreos.com/v1kind: Prometheusmetadata: name: prometheus labels: app: strimzispec: replicas: 1 serviceAccountName: prometheus-server serviceMonitorSelector: matchLabels: app: strimzi podMonitorSelector: matchLabels: app: strimzi resources: requests: memory: 400Mi enableAdminAPI: false ruleSelector: matchLabels: role: alert-rules app: strimzi alerting: alertmanagers: - namespace: default name: alertmanager port: alertmanager additionalScrapeConfigs: name: additional-scrape-configs key: prometheus-additional.yaml- strimzi-pod-monitor.yaml:
将namespaceSelector.matchNames修改为kafka,我们需要监控的命名空间为kafka
apiVersion: monitoring.coreos.com/v1kind: PodMonitormetadata: name: cluster-operator-metrics labels: app: strimzispec: selector: matchLabels: strimzi.io/kind: cluster-operator namespaceSelector: matchNames: - kafka podMetricsEndpoints: - path: /metrics port: http---apiVersion: monitoring.coreos.com/v1kind: PodMonitormetadata: name: entity-operator-metrics labels: app: strimzispec: selector: matchLabels: app.kubernetes.io/name: entity-operator namespaceSelector: matchNames: - kafka podMetricsEndpoints: - path: /metrics port: healthcheck---apiVersion: monitoring.coreos.com/v1kind: PodMonitormetadata: name: bridge-metrics labels: app: strimzispec: selector: matchLabels: strimzi.io/kind: KafkaBridge namespaceSelector: matchNames: - kafka podMetricsEndpoints: - path: /metrics port: rest-api---apiVersion: monitoring.coreos.com/v1kind: PodMonitormetadata: name: kafka-metrics labels: app: strimzispec: selector: matchExpressions: - key: "strimzi.io/kind" operator: In values: ["Kafka", "KafkaConnect"] namespaceSelector: matchNames: - kafka podMetricsEndpoints: - path: /metrics port: tcp-prometheus relabelings: - separator: ; regex: __meta_kubernetes_pod_label_(.+) replacement: $1 action: labelmap - sourceLabels: [__meta_kubernetes_namespace] separator: ; regex: (.*) targetLabel: namespace replacement: $1 action: replace - sourceLabels: [__meta_kubernetes_pod_name] separator: ; regex: (.*) targetLabel: kubernetes_pod_name replacement: $1 action: replace - sourceLabels: [__meta_kubernetes_pod_node_name] separator: ; regex: (.*) targetLabel: node_name replacement: $1 action: replace - sourceLabels: [__meta_kubernetes_pod_host_ip] separator: ; regex: (.*) targetLabel: node_ip replacement: $1 action: replace - 通过prometheus-additional.yaml创建Secret
kubectl create secret generic additional-scrape-configs --from-file=prometheus-additional.yaml此时prometheus.yaml的additionalScrapeConfigs属性使用这个Secret的名称additional-scrape-configs
- 部署
kubectl apply -f strimzi-pod-monitor.yamlkubectl apply -f prometheus-rules.yamlkubectl apply -f prometheus.yaml1.3 安装配置Grafana
1.3.1 安装访问Grafana
- 安装Grafana:strimzi-0.19.0/examples/metrics/grafana-install/grafana.yaml
kubectl apply -f grafana.yaml- 代理访问grafana
kubectl port-forward svc/grafana 3000:3000http://localhost:3000,默认账号密码:admin/admin
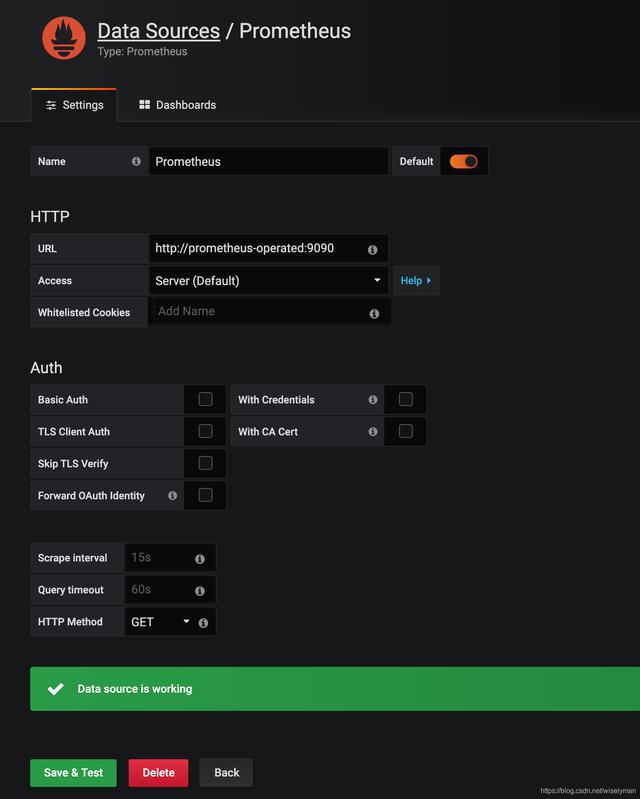
1.3.2 添加Prometheus数据源
- Add data source -> Prometheus->http://prometheus-operated:9090->Save & Test
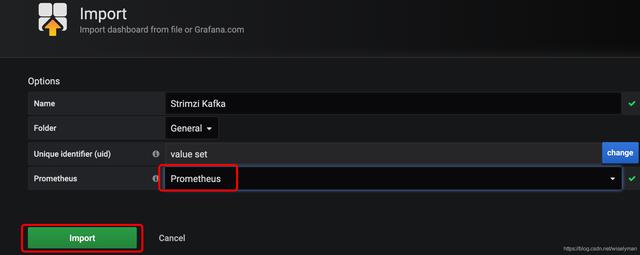
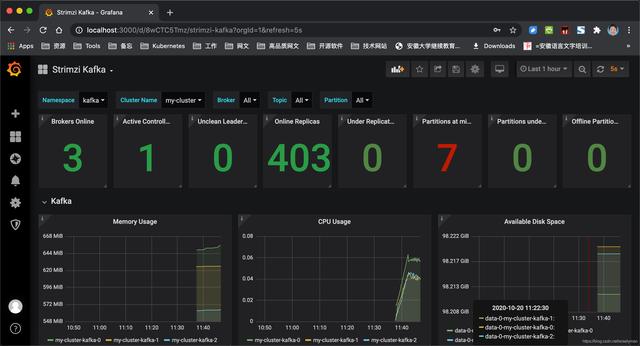
1.3.3 导入监控的dashboards
- 健康的dashboard配置都在strimzi-0.19.0/examples/metrics/grafana-dashboards下,可以通过grafana导入。
- 点击左侧➕->Import,可从文件夹导入Dashboardstrimzi-0.19.0/examples/metrics/grafana-dashboards的json文件,或者直接粘贴:

2.Strimzi Kafka Exporter
2.1 更新部署Kafka集群配置
- Kafka Exporter监控,在我们的kafka-persistent.yml尾部添加
kafkaExporter: topicRegex: ".*" groupRegex: ".*"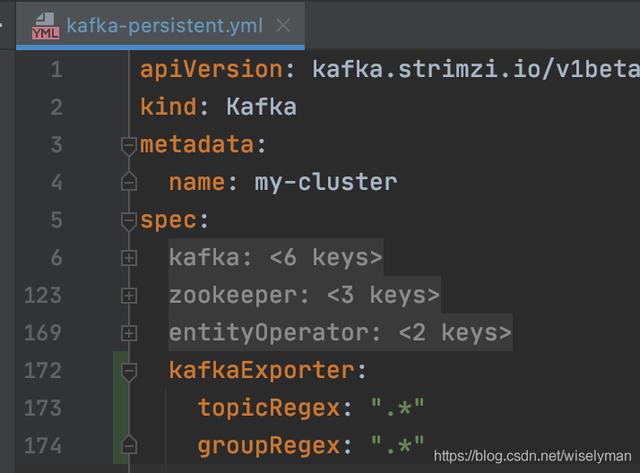
- 更新部署Kafka
kubectl apply -f kafka-persistent.yml -n kafka2.2 配置监控dashboard
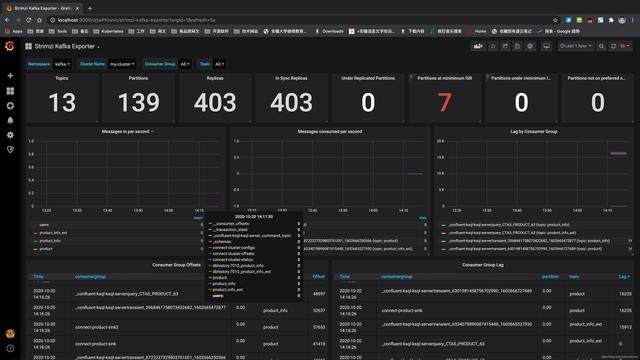
- grafana导入strimzi-0.19.0/examples/metrics/grafana-dashboards/strimzi-kafka-exporter.json


 1453
1453


 被折叠的 条评论
为什么被折叠?
被折叠的 条评论
为什么被折叠?
 到【灌水乐园】发言


