


InfluxDB + Telegraf + Grafana 监控体系
Telegraf 采集系统负载等数据并存储到InfluxDB,Grafana从InfluxDB获取数据并图形化展示。
InfluxDB
InfluxDB 是一个开源分布式时序、事件和指标数据库。
使用 Go 语言编写,无需外部依赖。
其设计目标是实现分布式和水平伸缩扩展。
InfluxDB 包括用于存储和查询数据,在后台处理ETL或监视和警报目的,用户仪表板以及可视化和探索数据等的API。
InfluxDB 的开源版本只支持一个节点。
下载地址: https://mirrors.tuna.tsinghua.edu.cn/influxdata/yum/el7-x86_64/
1)概念介绍
在 InfluxDB 中,我们可以粗略的将要存入的一条数据看作一个虚拟的 key 和其对应的 value(field value)。
格式如下:
cpu_usage,host=server01,region=us-west value=0.64 1434055562000000000
虚拟的 key 包括以下几个部分:
database:数据库名,在 InfluxDB 中可以创建多个数据库,不同数据库中的数据文件是隔离存放的,存放在磁盘上的不同目录。
retention policy:存储策略,用于设置数据保留的时间,每个数据库刚开始会自动创建一个默认的存储策略 autogen,数据保留时间为永久,之后用户可以自己设置,例如保留最近2小时的数据。插入和查询数据时如果不指定存储策略,则使用默认存储策略,且默认存储策略可以修改。InfluxDB 会定期清除过期的数据。
measurement:测量指标名,例如 cpu_usage 表示 cpu 的使用率。
tag sets:tags 在 InfluxDB 中会按照字典序排序,不管是 tagk 还是 tagv,只要不一致就分别属于两个 key,例如 host=server01,region=us-west 和 host=server02,region=us-west 就是两个不同的 tag set。
tag:标签,在InfluxDB中,tag是一个非常重要的部分,表名+tag一起作为数据库的索引,是“key-value”的形式。
field name:例如上面数据中的 value 就是 fieldName,InfluxDB 中支持一条数据中插入多个 fieldName,这其实是一个语法上的优化,在实际的底层存储中,是当作多条数据来存储。
timestamp:每一条数据都需要指定一个时间戳,在 TSM 存储引擎中会特殊对待,以为了优化后续的查询操作。
TSM 存储引擎:
由几个部分组成:cache、wal、tsm file、compactor;
cache 相当于是 LSM Tree 中的 memtabl。插入数据时,实际上是同时往 cache 与 wal 中写入数据,可以认为 cache 是 wal 文件中的数据在内存中的缓存。当 InfluxDB 启动时,会遍历所有的 wal 文件,重新构造 cache,这样即使系统出现故障,也不会导致数据的丢失。cache 中的数据并不是无限增长的,有一个 maxSize 参数用于控制当 cache 中的数据占用多少内存后就会将数据写入 tsm 文件。每当 cache 中的数据达到阀值后,会将当前的 cache 进行一次快照,之后清空当前 cache 中的内容,再创建一个新的 wal 文件用于写入,剩下的 wal 文件最后会被删除,快照中的数据会经过排序写入一个新的 tsm 文件中。
wal 文件的内容与内存中的 cache 相同,其作用就是为了持久化数据,当系统崩溃后可以通过 wal 文件恢复还没有写入到 tsm 文件中的数据。
tsm file 用于存放数据。
compactor 组件在后台持续运行,每隔 1 秒会检查一次是否有需要压缩合并的数据。
2)安装
[root@node1 ~]# rpm -ivh influxdb-1.8.0.x86_64.rpm warning: influxdb-1.8.0.x86_64.rpm: Header V4 RSA/SHA256 Signature, key ID 2582e0c5: NOKEYPreparing... ################################# [100%]Updating / installing... 1:influxdb-1.8.0-1 ################################# [100%]Created symlink from /etc/systemd/system/influxd.service to /usr/lib/systemd/system/influxdb.service.Created symlink from /etc/systemd/system/multi-user.target.wants/influxdb.service to /usr/lib/systemd/system/influxdb.service.[root@node1 ~]# systemctl start influxdb3)数据库和表的基本操作
InfluxDB用 database 表示数据库,measurement表示数据库中的表,points表示表里面的一行数据;
InfluxDB中没有显式的新建表的语句,只能通过insert数据的方式来建立新表;
[root@node1 ~]# influxConnected to http://localhost:8086 version 1.8.0InfluxDB shell version: 1.8.0> create database sysinfo> show databasesname: databasesname----_internalsysinfo> use sysinfoUsing database sysinfo> insert disk_free,homename=node1 value=442221834240i> show measurementsname: measurementsname----disk_free> select * from disk_freename: disk_freetime homename value---- -------- -----1596074311388342642 node1 442221834240> drop measurement disk_free> show measurements> drop database sysinfo> show databasesname: databasesname----_internal4)数据保存策略
influxDB是没有提供直接删除数据记录的方法,但是提供数据保存策略,主要用于指定数据保留时间,超过指定时间,就删除这部分数据;
> create database sysinfo> show retention policies on sysinfoname duration shardGroupDuration replicaN default---- -------- ------------------ -------- -------autogen 0s 168h0m0s 1 true> create retention policy myreten on sysinfo duration 3w replication 1 default> show retention policies on sysinfoname duration shardGroupDuration replicaN default---- -------- ------------------ -------- -------autogen 0s 168h0m0s 1 falsemyreten 504h0m0s 24h0m0s 1 true> alter retention policy myreten on sysinfo duration 30d default> show retention policies on sysinfoname duration shardGroupDuration replicaN default---- -------- ------------------ -------- -------autogen 0s 168h0m0s 1 falsemyreten 720h0m0s 24h0m0s 1 true> drop retention policy myreten on sysinfo> show retention policies on sysinfoname duration shardGroupDuration replicaN default---- -------- ------------------ -------- -------autogen 0s 168h0m0s 1 false> drop database sysinfo5)创建用户
> create database sysinfo> use sysinfoUsing database sysinfo> create user "opser" with password 'centos' with all privileges> show usersuser admin---- -----opser trueTelegraf
Telegraf 是实现数据采集的工具;
Telegraf 有以下几种插件:
Inputs 插件:收集各种时间序列性指标,包含各种系统信息和应用信息的插件。
Process 插件:当收集到的指标数据流要进行一些简单处理时,比如给所有指标添加、删除、修改一个Tag。只是针对当前的指标数据进行。
Aggregate 插件:聚合插件有别于处理插件,就在于它要处理的对象是某段时间流经该插件的所有数据(所以,每个聚合插件都有一个设置,只会处理时间段内的数据),比如取最大值、最小值、平均值等操作。
Outputs 插件:收集到的数据,经过处理和聚合后,输出到数据存储系统,可以是各种地方,如:文件、InfluxDB、各种消息队列服务等等。
下载地址:
https://mirrors.tuna.tsinghua.edu.cn/influxdata/yum/el7-x86_64/
安装配置
[root@node1 ~]# rpm -ivh telegraf-1.9.5-1.x86_64.rpm warning: telegraf-1.9.5-1.x86_64.rpm: Header V4 RSA/SHA256 Signature, key ID 2582e0c5: NOKEYPreparing... ################################# [100%]Updating / installing... 1:telegraf-1.9.5-1 ################################# [100%]Created symlink from /etc/systemd/system/multi-user.target.wants/telegraf.service to /usr/lib/systemd/system/telegraf.service.[root@node1 ~]# cp /etc/telegraf/telegraf.conf /etc/telegraf/telegraf.conf.bak# 只修改outputs.influxdb配置块,其它保持默认[root@node1 ~]# vim /etc/telegraf/telegraf.conf[root@node1 ~]# egrep -v "#|^$" /etc/telegraf/telegraf.conf[global_tags][agent] interval = "10s" round_interval = true metric_batch_size = 1000 metric_buffer_limit = 10000 collection_jitter = "0s" flush_interval = "10s" flush_jitter = "0s" precision = "" debug = false quiet = false logfile = "" hostname = "" omit_hostname = false[[outputs.influxdb]] urls = ["http://127.0.0.1:8086"] database = "sysinfo" skip_database_creation = true retention_policy = "" write_consistency = "any" timeout = "5s" username = "opser" password = "centos"[[inputs.cpu]] percpu = true totalcpu = true collect_cpu_time = false report_active = false[[inputs.disk]] ignore_fs = ["tmpfs", "devtmpfs", "devfs", "overlay", "aufs", "squashfs"][[inputs.diskio]][[inputs.kernel]][[inputs.mem]][[inputs.processes]][[inputs.swap]][[inputs.system]][root@node1 ~]# systemctl start telegraf查看是否采集数据并保存到InfluxDB
[root@node1 ~]# influxConnected to http://localhost:8086 version 1.8.0InfluxDB shell version: 1.8.0> use sysinfoUsing database sysinfo> show measurementsname: measurementsname----cpudiskdiskiokernelmemprocessesswapsystem> select * from cpuname: cputime cpu host usage_guest usage_guest_nice usage_idle usage_iowait usage_irq usage_nice usage_softirq usage_steal usage_system usage_user---- --- ---- ----------- ---------------- ---------- ------------ --------- ---------- ------------- ----------- ------------ ----------1596076200000000000 cpu-total node1.newbie.local 0 0 99.69879518072544 0 0 0 0 0 0.15060240963855734 0.150602409638559561596076200000000000 cpu0 node1.newbie.local 0 0 99.69909729187363 0 0 0 0 0 0.20060180541624825 0.10030090270812191596076200000000000 cpu1 node1.newbie.local 0 0 99.59839357429756 0 0 0 0.10040160642570253 0 0.20080321285140953 0.100401606425702531596076210000000000 cpu-total node1.newbie.local 0 0 99.79969954932417 0 0 0 0.050075112669002914 0 0.10015022533801249 0.0500751126690040241596076210000000000 cpu0 node1.newbie.local 0 0 100 0 0 0 0 0 0 0...略Grafana
Grafana 是一款采用 go 语言编写的开源应用,主要用于大规模指标数据的可视化展现,是网络架构和应用分析中最流行的时序数据展示工具,目前已经支持绝大部分常用的时序数据库。
下载地址: https://mirrors.tuna.tsinghua.edu.cn/grafana/yum/rpm/
1)安装
[root@node1 ~]# yum install -y fontconfig urw-fonts...略[root@node1 ~]# rpm -ivh grafana-6.5.3-1.x86_64.rpm warning: grafana-6.5.3-1.x86_64.rpm: Header V4 RSA/SHA1 Signature, key ID 24098cb6: NOKEYPreparing... ################################# [100%]Updating / installing... 1:grafana-6.5.3-1 ################################# [100%]### NOT starting on installation, please execute the following statements to configure grafana to start automatically using systemd sudo /bin/systemctl daemon-reload sudo /bin/systemctl enable grafana-server.service### You can start grafana-server by executing sudo /bin/systemctl start grafana-server.servicePOSTTRANS: Running script[root@node1 ~]# systemctl daemon-reload[root@node1 ~]# systemctl start grafana-server[root@node1 ~]# systemctl enable grafana-server2)配置邮件地址
[root@integra ~]# vim /etc/grafana/grafana.ini#################################### SMTP / Emailing ##########################[smtp]enabled = truehost = smtp.qq.com:25user = 155xxxxxxx@qq.compassword = xxxxxxxxskip_verify = truefrom_address = 155xxxxxxx@qq.comfrom_name = Newbie Alert完成整个监控体系
访问http://10.0.0.11:3000/,用admin/admin登陆,登陆以后可以修改默认密码,也可以直接跳过;
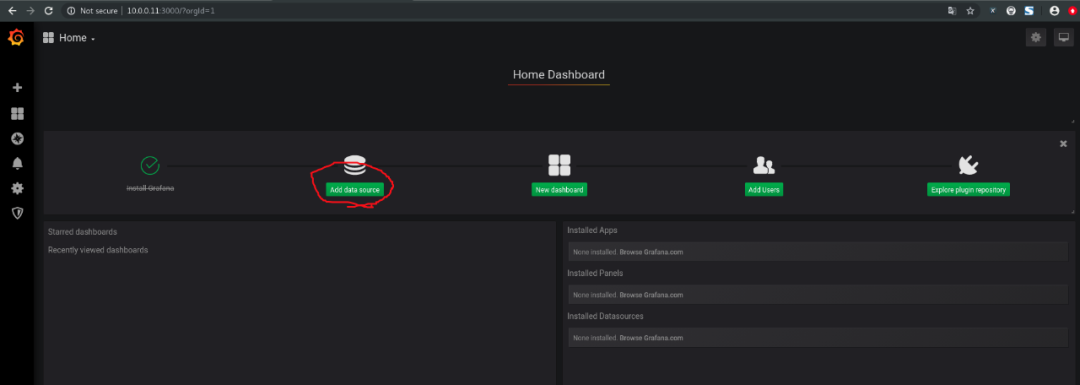
登陆以后,在首页点击Add data source或者右侧导航选择Configuration,添加数据源
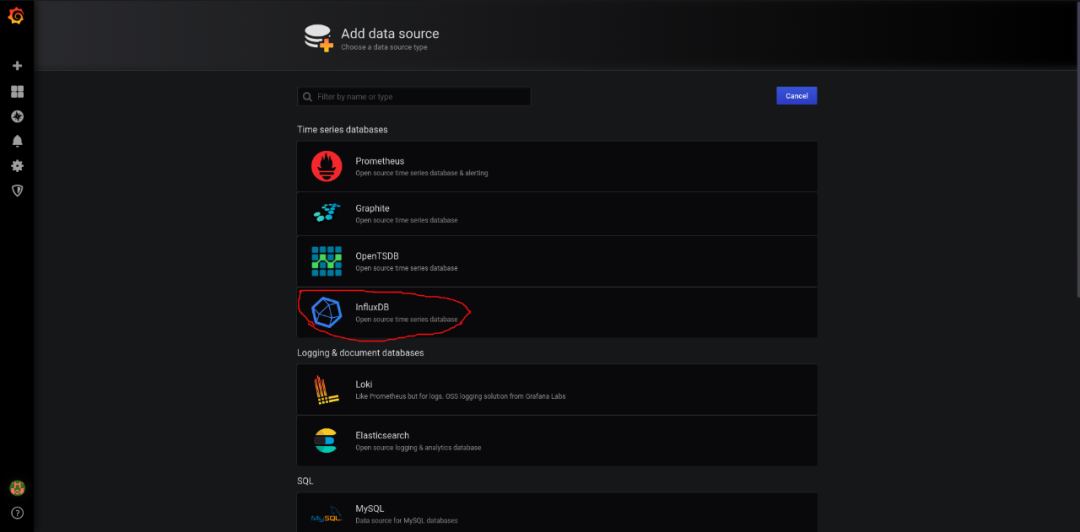
选择InfluxDB
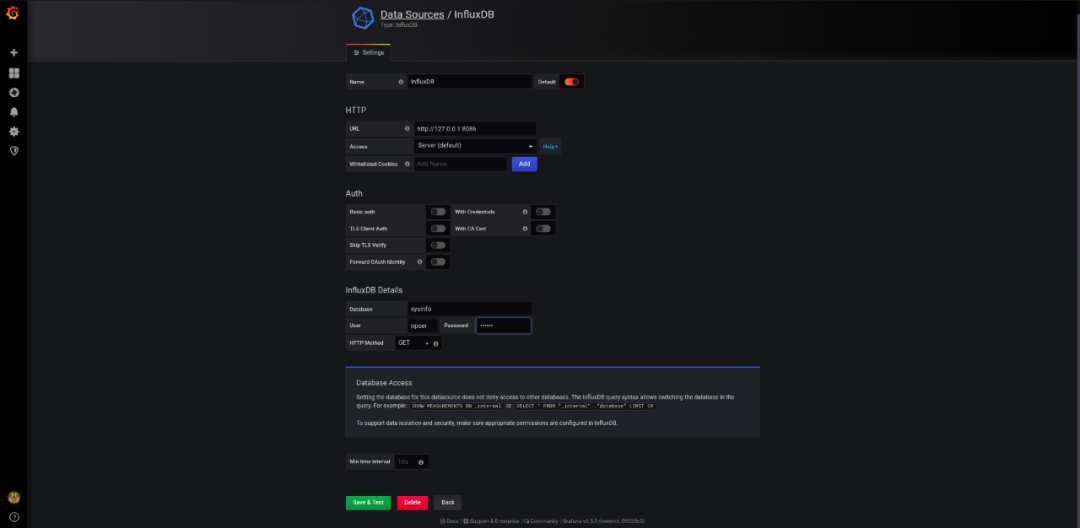
填写URL、Database、User、Password,其它默认即可,然后保存测试
回到首页,添加dashboard,Add Query
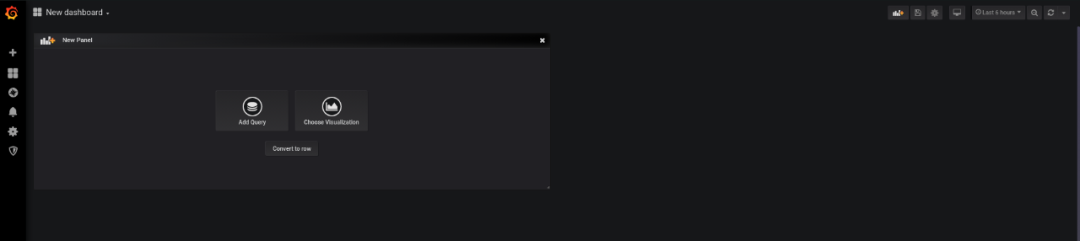
Add Query
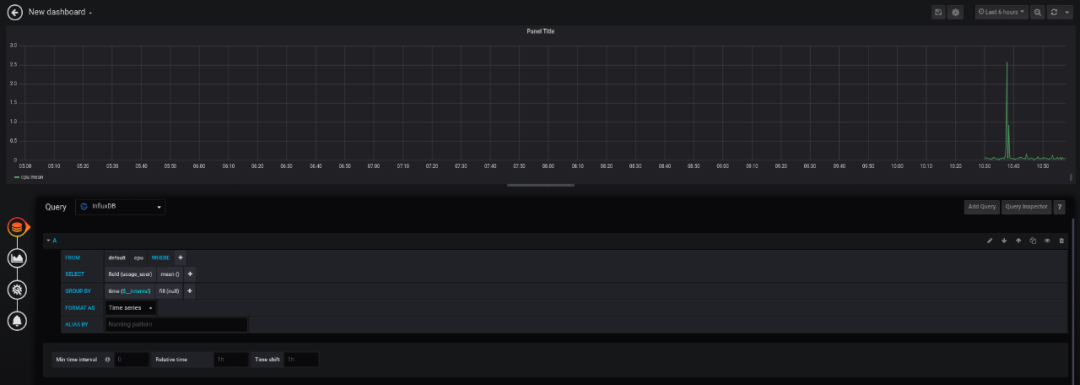
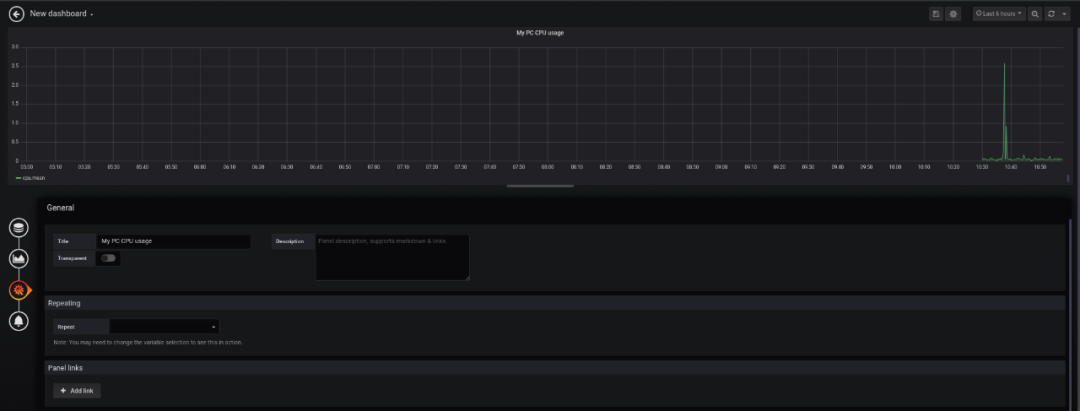
最后保存即可;
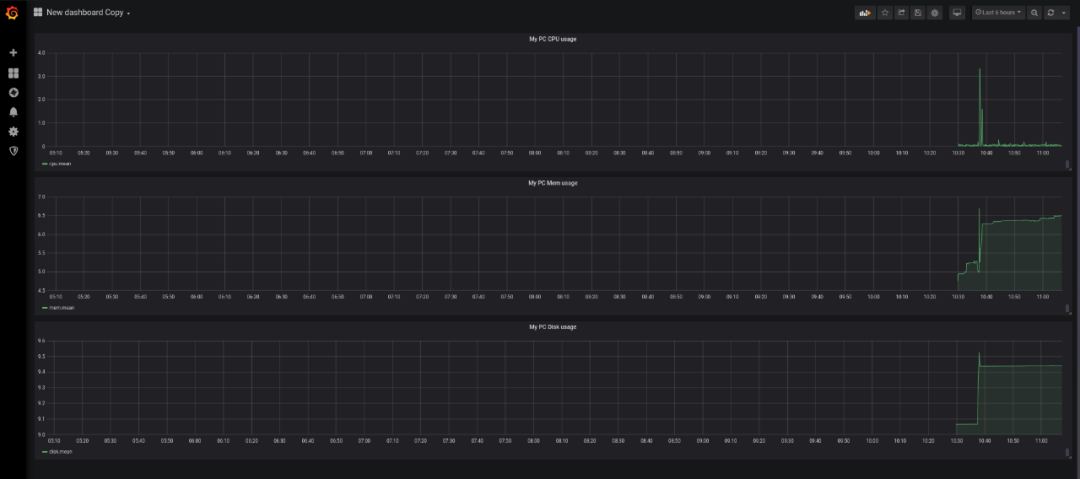
按同样的方法添加内存使用率和硬盘使用率看板,最后的结果


 1万+
1万+


 被折叠的 条评论
为什么被折叠?
被折叠的 条评论
为什么被折叠?
 到【灌水乐园】发言


