


 本节你将学到绘制折线图绘制散点图调整曲线的颜色、粗细调整图标标签绘制简单折线图折线图的绘制,需要用到matplotlib.pyplot库,利用其中的plot()方法实现折线图的绘制。import matplotlib.pyplot as pltinput_values=[1,2,3,4,5]squares = [1,4,9,16,25]plt.plot(squares)plt.show(...

本节你将学到
绘制折线图
绘制散点图
调整曲线的颜色、粗细
调整图标标签
绘制简单折线图
折线图的绘制,需要用到matplotlib.pyplot库,利用其中的plot()方法实现折线图的绘制。
import matplotlib.pyplot as pltinput_values=[1,2,3,4,5]squares = [1,4,9,16,25]plt.plot(squares)plt.show()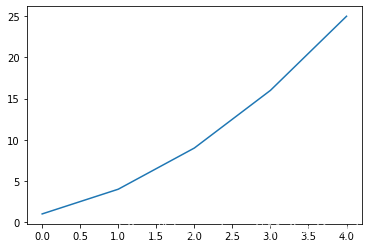
上面画出了输入数值为[1,2,3,4,5],输出数值为其平方的折线图。但是缺少相应的标签来说明图的情况。
修改标签
plt.plot(squares,linewidth=5)# 以下代码设置了图标的标题并给坐标轴加上标签。plt.title("Square Numbers",fontsize=24)plt.xlabel(" 最低0.47元/天 解锁文章


 1048
1048


 被折叠的 条评论
为什么被折叠?
被折叠的 条评论
为什么被折叠?
 到【灌水乐园】发言


