


在本章中,我们将学习错误的内存崩溃。
在崩溃报告中,我们可以通过异常类型 EXC_BAD_ACCESS (SIGSEGV) 或 EXC_BAD_ACCESS (SIGBUS)来进行区分。
我们来看看通过搜索互联网获得的一系列崩溃现象。
一般原则
在操作系统中,管理内存的方法是首先将连续的内存排序为内存页,然后将页面排序为段。这允许将元数据属性分配给应用于该段内的所有页面的段。这允许我们的程序代码(程序 TEXT )被设置为只读但可执行。提高了性能和安全性。
SIGBUS(总线错误)表示内存地址已正确映射到进程的地址区间,但不允许进程访问内存。
SIGSEGV(段冲突)表示存储器地址甚至没有映射到进程地址区间。
段冲突 (SEGV)崩溃
fud 崩溃
fud 程序是私有框架 MobileAccessoryUpdater中的一个未记录的进程。
在这里,我们显示了macOS上进程 fud的崩溃报告,为了便于演示,该报告已被截断:
Process:               fud [84641]
Path:                  /System/Library/PrivateFrameworks/
MobileAccessoryUpdater.framework/Support/fud
Identifier:            fud
Version:               106.50.4
Code Type:             X86-64 (Native)
Parent Process:        launchd [1]
Responsible:           fud [84641]
User ID:               0

Date/Time:             2018-06-12 08:34:15.054 +0100
OS Version:            Mac OS X 10.13.4 (17E199)
Report Version:        12
Anonymous UUID:        6C1D2091-02B7-47C4-5BF9-E99AD5C45875

Sleep/Wake UUID:       369D13CB-F0D3-414B-A177-38B1E560EEC7

Time Awake Since Boot: 240000 seconds
Time Since Wake:       47 seconds

System Integrity Protection: enabled

Crashed Thread:        1
  Dispatch queue: com.apple.fud.processing.queue

Exception Type:        EXC_BAD_ACCESS (SIGSEGV)
Exception Codes:       EXC_I386_GPFLT
Exception Note:        EXC_CORPSE_NOTIFY

Termination Signal:    Segmentation fault: 11
Termination Reason:    Namespace SIGNAL, Code 0xb
Terminating Process:   exc handler [0]

Thread 1 Crashed:: Dispatch queue:
 com.apple.fud.processing.queue
0   libdispatch.dylib               0x00007fff67fc6cbd
 _dispatch_continuation_push + 4
1   fud                             0x0000000101d3ce57
 __38-[FudController handleXPCStreamEvent:]_block_invoke + 593
2   libdispatch.dylib               0x00007fff67fbb64a
 _dispatch_call_block_and_release + 12
3   libdispatch.dylib               0x00007fff67fb3e08
 _dispatch_client_callout + 8
4   libdispatch.dylib               0x00007fff67fc8377
 _dispatch_queue_serial_drain + 907
5   libdispatch.dylib               0x00007fff67fbb1b6
 _dispatch_queue_invoke + 373
6   libdispatch.dylib               0x00007fff67fc8f5d
 _dispatch_root_queue_drain_deferred_wlh + 332
7   libdispatch.dylib               0x00007fff67fccd71
 _dispatch_workloop_worker_thread + 880
8   libsystem_pthread.dylib         0x00007fff68304fd2
 _pthread_wqthread + 980
9   libsystem_pthread.dylib         0x00007fff68304be9
 start_wqthread + 13

Thread 1 crashed with X86 Thread State (64-bit):
  rax: 0xe00007f80bd22039  rbx: 0x00007f80bd2202e0
    rcx: 0x7fffffffffffffff
    rdx: 0x011d800101d66da1
  rdi: 0x00007f80bd21a250  rsi: 0x0000000102c01000
    rbp: 0x0000700007e096c0
    rsp: 0x0000700007e09670
   r8: 0x0000000102c00010   r9: 0x0000000000000001
     r10: 0x0000000102c01000
     r11: 0x00000f80b5300430
  r12: 0x00007f80ba70c670  r13: 0x00007fff673c8e80
    r14: 0x00007f80bd201e00
    r15: 0x00007f80ba70cf30
  rip: 0x00007fff67fc6cbd  rfl: 0x0000000000010202
    cr2: 0x00007fff9b2f11b8

Logical CPU:     3
Error Code:      0x00000004
Trap Number: 14我们显然有一个不好的内存问题,因为我们有一个EXC_BAD_ACCESS (SIGSEGV)(SIGSEGV)异常。我们看到的错误代码是 14,在https://github.com/apple/darwin-xnu中属于缺页中断。
由于 libdispatch是 Apple 开源的,我们甚至可以查找触发崩溃的函数。(“Libdispatch Open Source” 2018)
我们看到:
#define dx_push(x, y, z) dx_vtable(x)->do_push(x, y, z)

DISPATCH_NOINLINE
static void
_dispatch_continuation_push(dispatch_queue_t dq,
   dispatch_continuation_t dc)
{
    dx_push(dq, dc, _dispatch_continuation_override_qos(dq, dc));
}
我们正在从一个有错误内存位置的数据结构中解除内存引用。
我们可以反汇编问题调用站点的macOS二进制文件/usr/lib/system/libdispatch.dylib。
在这里,我们使用 Hopper 进行脱壳:
__dispatch_continuation_push:
0000000000014c69 push       rbx
                             ; CODE XREF=__dispatch_async_f2+112,
                             j___dispatch_continuation_push
0000000000014c6a mov        rax, qword [rdi]
0000000000014c6d mov        r8, qword [rax+0x40]
0000000000014c71 mov        rax, qword [rsi+8]
0000000000014c75 mov        edx, eax
0000000000014c77 shr        edx, 0x8
0000000000014c7a and        edx, 0x3fff
0000000000014c80 mov        ebx, dword [rdi+0x58]
0000000000014c83 movzx      ecx, bh
0000000000014c86 je loc_14ca3rdi寄存器值似乎有问题,地址为 0x00007f80bd21a250
我们需要退一步,了解为什么我们有内存访问问题。
查看堆栈回溯,我们可以看到该程序使用跨进程通信(XPC)来完成其工作。它有 handleXPCStreamEvent 函数。
这是一个常见的编程问题,当我们接收到一个数据有效负载时,就会出现解压缩有效负载和解释数据的问题。我们推测反序列化代码中有一个bug。这将给我们一个潜在的坏数据结构,我们取消引用会导致崩溃。
如果我们是fud程序的作者,我们可以对其进行更新以检查它获得的XPC数据,并确保遵循最佳实践进行数据的序列化/反序列化,例如使用接口定义层生成器。
LeakAgent 崩溃
苹果提供了 LeakAgent 程序作为其内存诊断工具的一部分。它在 Xcode Instruments 中使用。
以下是崩溃报告, LeakAgent 发生了崩溃,为了便于演示而被截断:
Incident Identifier: 11ED1987-1BC9-4F44-900C-AD07EE6F7E26
CrashReporter Key:   b544a32d592996e0efdd7f5eaafd1f4164a2e13c
Hardware Model:      iPad6,3
Process:             LeakAgent [3434]
Path:                /Developer/Library/PrivateFrameworks/
DVTInstrumentsFoundation.framework/LeakAgent
Identifier:          LeakAgent
Version:             ???
Code Type:           ARM-64 (Native)
Role:                Unspecified
Parent Process:      DTServiceHub [1592]
Coalition:           com.apple.instruments.deviceservice
 [463]


Date/Time:           2018-07-19 14:16:57.6977 +0100
Launch Time:         2018-07-19 14:16:56.7734 +0100
OS Version:          iPhone OS 11.3 (15E216)
Baseband Version:    n/a
Report Version:      104

Exception Type:  EXC_BAD_ACCESS (SIGSEGV)
Exception Subtype: KERN_INVALID_ADDRESS at
 0x0000000000000000
VM Region Info: 0 is not in any region.
  Bytes before following region: 4371873792
      REGION TYPE                      START - END
                   [ VSIZE] PRT/MAX SHRMOD  REGION DETAIL
      UNUSED SPACE AT START
--->
      __TEXT        0000000104958000-0000000104964000
       [   48K] r-x/r-x SM=COW  ...ork/LeakAgent

Termination Signal: Segmentation fault: 11
Termination Reason: Namespace SIGNAL, Code 0xb
Terminating Process: exc handler [0]
Triggered by Thread:  4

Thread 4 name:  Dispatch queue:
DTXChannel serializer queue [x1.c0]
Thread 4 Crashed:
0   libswiftDemangle.dylib
0x0000000104f871dc 0x104f70000 + 94684
1   libswiftDemangle.dylib
0x0000000104f8717c 0x104f70000 + 94588
2   libswiftDemangle.dylib
0x0000000104f86200 0x104f70000 + 90624
3   libswiftDemangle.dylib
0x0000000104f84948 0x104f70000 + 84296
4   libswiftDemangle.dylib
0x0000000104f833a4 0x104f70000 + 78756
5   libswiftDemangle.dylib
0x0000000104f73290 0x104f70000 + 12944
6   CoreSymbolication
0x000000019241d638 demangle + 112
7   CoreSymbolication
0x00000001923d16cc
 TRawSymbol::name+ 54988 () + 72
8   CoreSymbolication
0x0000000192404ff4
 TRawSymbolOwnerData::
 symbols_for_name(CSCppSymbolOwner*, char const*,
    void + 266228 (_CSTypeRef) block_pointer) + 156
9   CoreSymbolication
0x00000001923d9734
 CSSymbolOwnerGetSymbolWithName + 116
10  Symbolication
0x000000019bb2e7f4
 -[VMUObjectIdentifier _targetProcessSwiftReflectionVersion]
  + 120
11  Symbolication
0x000000019bb2f9d8
 -[VMUObjectIdentifier loadSwiftReflectionLibrary] + 36
12  Symbolication
0x000000019bb29ff0
 -[VMUObjectIdentifier initWithTask:symbolicator:scanner:]
  + 436
13  Symbolication
0x000000019baede10
 -[VMUTaskMemoryScanner _initWithTask:options:] + 2292
14  Symbolication
0x000000019baee304
 -[VMUTaskMemoryScanner initWithTask:options:] + 72
15  LeakAgent
0x000000010495b270 0x104958000 + 12912
16  CoreFoundation
0x0000000183f82580 __invoking___ + 144
17  CoreFoundation                  0x0000000183e61748
 -[NSInvocation invoke] + 284
18  DTXConnectionServices
0x000000010499f230 0x104980000 + 127536
19  DTXConnectionServices
0x00000001049947a4 0x104980000 + 83876
20  libdispatch.dylib               0x000000018386cb24
 _dispatch_call_block_and_release + 24
21  libdispatch.dylib               0x000000018386cae4
 _dispatch_client_callout + 16
22  libdispatch.dylib               0x0000000183876a38
 _dispatch_queue_serial_drain$VARIANT$mp + 608
23  libdispatch.dylib               0x0000000183877380
 _dispatch_queue_invoke$VARIANT$mp + 336
24  libdispatch.dylib               0x0000000183877d4c
 _dispatch_root_queue_drain_deferred_wlh$VARIANT$mp + 340
25  libdispatch.dylib               0x000000018388011c
 _dispatch_workloop_worker_thread$VARIANT$mp + 668
26  libsystem_pthread.dylib         0x0000000183b9fe70
 _pthread_wqthread + 860
27  libsystem_pthread.dylib
0x0000000183b9fb08 start_wqthread + 4
Thread 4 crashed with ARM Thread State (64-bit):
    x0: 0x0000000000000000   x1: 0x0000000000000000
    x2: 0xfffffffffffffff6
       x3: 0x0000000000000041
    x4: 0x0000000000000000   x5: 0x0000000104f97950
    x6: 0x0000000000000006
       x7: 0x00000000ffffffff
    x8: 0x00000001050589d0   x9: 0x0000000104f840d8
    x10: 0xffffffffffffd544
      x11: 0x0000000000000a74
   x12: 0x0000000000000002  x13: 0x00000000000002aa
   x14: 0x00000000000002aa
     x15: 0x00000000000003ff
   x16: 0x0000000183b96360  x17: 0x0000000000200000
   x18: 0x0000000000000000
     x19: 0x000000016b6d1ba0
   x20: 0x00000001050589a0  x21: 0x0000000000000000
   x22: 0x0000000000000000
     x23: 0x0000000000000001
   x24: 0x00000000ffffffff  x25: 0x0000000000000006
   x26: 0x0000000104f97950
     x27: 0x0000000000000000
   x28: 0x0000000000000009   fp: 0x000000016b6d19c0
   lr: 0x0000000104f8717c
    sp: 0x000000016b6d1930   pc: 0x0000000104f871dc
cpsr: 0x60000000我们可以看到出错的内核地址是0x0000000000000000,所以它是一个空指针解引用。我们崩溃的调用站点是一个分解符号的 Swift 库。Xcode 工具试图从它在 iPad 上看到的活动中提供人类可读的对象类型定义。
如果我们是用户并视图分析我们的应用程序,然后在LeakAgent中遇到此错误,那么我们需要尝试找出避免该问题的方法。
由于问题是由于符号化造成的,所以明智的做法是清除构建目录,然后进行一次干净的构建。有时,Xcode更新会将我们切换到不兼容的新目标文件格式。值得与另一个项目(可能是微不足道的测试程序)一起检查性能。还有其他内存分析工具,例如我们正在运行的方案的诊断选项,因此可以用不同的方式进行内存分析。有关更多信息,请参见下一章内存诊断 。
总线错误(SIGBUS)崩溃
xbmc 崩溃
xbmc 应用程序是一款实用应用程序,其作用类似于电视媒体播放器的遥控器。
在启动过程中,应用程序发生崩溃并产生以下崩溃报告,为便于演示,该报告已被截断:
Incident Identifier: 396B3641-5F74-4B01-9E62-FE24A2C12E92
CrashReporter Key:   14aa0286b8b087d8b6a1ca75201a3f7d8c52d5bd
Hardware Model:      iPad1,1
Process:         XBMC [5693]
Path:            /var/mobile/Applications/
94088F35-1CDB-47CD-9D3C-328E39C2589F/XBMC.app/XBMC
Identifier:      XBMC
Version:         ??? (???)
Code Type:       ARM (Native)
Parent Process:  launchd [1]

Date/Time:       2011-04-10 11:52:44.575 +0200
OS Version:      iPhone OS 4.3.1 (8G4)
Report Version:  104

Exception Type:  EXC_BAD_ACCESS (SIGBUS)
Exception Codes: 0x00000032, 0x047001b0
Crashed Thread:  4

Thread 4 Crashed:
0   dyld                            0x2fe1c8a0 strcmp + 0
1   dyld                            0x2fe0ce32
 ImageLoaderMachO::parseLoadCmds() + 30
2   dyld                            0x2fe1262c
 ImageLoaderMachOCompressed::instantiateFromFile
 (char const*, int,
    unsigned char const*, unsigned long long,
     unsigned long long,
     stat const&, unsigned int, unsigned int,
      linkedit_data_command const*,
      ImageLoader::LinkContext const&) + 228
3   dyld                            0x2fe0da14
 ImageLoaderMachO::instantiateFromFile
 (char const*, int,
    unsigned char const*, unsigned long long,
     unsigned long long,
     stat const&, ImageLoader::LinkContext const&) + 348
4   dyld                            0x2fe052e8
 dyld::loadPhase6(int, stat const&, char const*,
    dyld::LoadContext const&) + 576
5   dyld                            0x2fe053fe
 dyld::loadPhase5stat(char const*,
    dyld::LoadContext const&, stat*,
    int*, bool*, std::vector    std::allocator >*) + 174
6   dyld                            0x2fe055b4
 dyld::loadPhase5(char const*, char const*,
    dyld::LoadContext const&,
    std::vector     std::allocator >*) + 232
7   dyld                            0x2fe057fe
 dyld::loadPhase4(char const*, char const*,
   dyld::LoadContext const&,
    std::vector    std::allocator >*) + 302
8   dyld                            0x2fe064b2
 dyld::loadPhase3(char const*, char const*,
   dyld::LoadContext const&,
    std::vector    std::allocator >*) + 2514
9   dyld                            0x2fe065d0
 dyld::loadPhase1(char const*, char const*,
   dyld::LoadContext const&,
    std::vector    std::allocator >*) + 88
10  dyld                            0x2fe06798
 dyld::loadPhase0(char const*, char const*,
   dyld::LoadContext const&,
    std::vector    std::allocator >*) + 368
11  dyld                            0x2fe0688e
 dyld::load(char const*, dyld::LoadContext const&) + 178
12  dyld                            0x2fe08916 dlopen + 574
13  libdyld.dylib                   0x3678b4ae dlopen + 30
14  XBMC                            0x002276d4
 SoLoader::Load() (SoLoader.cpp:57)
15  XBMC                            0x0002976c
 DllLoaderContainer::LoadDll(char const*, bool)
  (DllLoaderContainer.cpp:250)
16  XBMC                            0x000299ce
 DllLoaderContainer::FindModule(char const*, char const*,
    bool) (DllLoaderContainer.cpp:147)
17  XBMC                            0x00029cca
 DllLoaderContainer::LoadModule(char const*, char const*,
    bool) (DllLoaderContainer.cpp:115)
18  XBMC                            0x0010c1a4
 CSectionLoader::LoadDLL(CStdStr const&, bool,
    bool) (SectionLoader.cpp:138)
19  XBMC                            0x000e9b10
 DllDynamic::Load() (DynamicDll.cpp:52)
20  XBMC                            0x002096c6
 ADDON::CAddonMgr::Init() (AddonManager.cpp:215)
21  XBMC                            0x004e447a
 CApplication::Create() (Application.cpp:644)
22  XBMC                            0x00510e42
 -[XBMCEAGLView runAnimation:] (XBMCEAGLView.mm:312)
23  Foundation                      0x3505b382
 -[NSThread main] + 38
24  Foundation
0x350cd5c6 __NSThread__main__ + 966
25  libsystem_c.dylib
0x3035530a _pthread_start + 242
26  libsystem_c.dylib
0x30356bb4 thread_start + 0
Thread 4 crashed with ARM Thread State:
    r0: 0x047001b0    r1: 0x2fe20ef0      r2: 0x01fe5f04
          r3: 0x2fe116d1
    r4: 0x00000001    r5: 0x01a46740      r6: 0x00000000
         r7: 0x01fe5264
    r8: 0x01a3f0fc    r9: 0x00000012     r10: 0x01fe6e60
         r11: 0x00000007
    ip: 0x2fe262f8    sp: 0x01fe5234      lr: 0x2fe0ce39
          pc: 0x2fe1c8a0
  cpsr: 0x00000010
Binary Images:
      0x1000 -   0xd98fff +XBMC armv7
         /var/mobile/Applications/
         94088F35-1CDB-47CD-9D3C-328E39C2589F/
         XBMC.app/XBMC
  0x2fe00000 - 0x2fe25fff  dyld armv7
    <8dbdf7bab30e355b81e7b2e333d5459b>
/usr/lib/dyld在此崩溃案例中,我们通过崩溃报告异常代码部分的第二个值说明了在位置0x047001b0 处的错误内存:
Exception Codes: 0x00000032, 0x047001b0注意,这也显示为寄存器 r0 的值(通常是这种情况)
这个值高于 XBMC 应用程序的二进制映射范围,低于崩溃报告的二进制映射部分中的 dyld 范围。
该地址必须映射到其中,但我们不知道崩溃报告将其映射到哪个段。
我们可以看到该应用程序可以动态配置。从回溯中我们可以看到:
13  libdyld.dylib                   0x3678b4ae dlopen + 30
14  XBMC                            0x002276d4
 SoLoader::Load() (SoLoader.cpp:57)
它正在调用动态加载程序,并根据 “AddOn” 管理器确定配置加载额外的代码:
20  XBMC                            0x002096c6
 ADDON::CAddonMgr::Init() (AddonManager.cpp:215)
诊断此类问题的最简单方法是让应用程序在尝试在运行时加载可选软件框架之前记录其配置。应用程序包可能缺少我们想要的库。
有时我们会集成第三方库,这些库中具有动态代码加载功能。在这种情况下,我们需要使用 Xcode 诊断工具。
我们没有XBMC应用程序的源代码。但是,有一个开源示例演示了动态加载程序的使用。 (“Dynamic Loading Example” 2018)
当我们运行该程序时,我们可以在应用程序编码的动态加载程序的使用中看到有用的消息。此外,我们可以通过如下修改 Scheme 设置, Dynamic Linker API Usage :
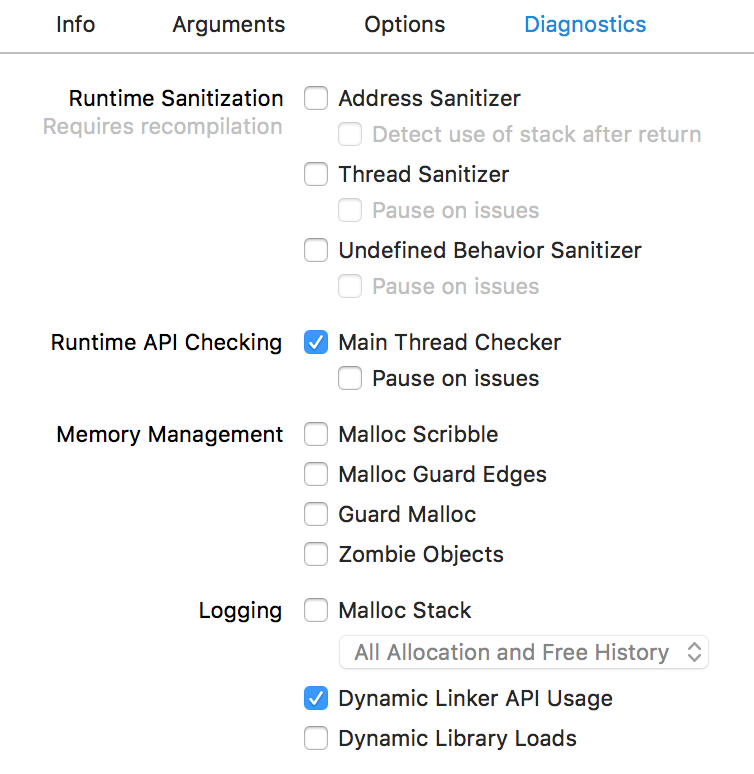
启动该程序后,我们可以看到它如何动态加载模块。除了我们的应用程序消息外,我们还会收到系统生成的消息。系统消息没有时间戳前缀,但应用程序消息却有。
这是一个经过修剪的调试日志,显示了我们看到的输出类型:
2018-08-18 12:26:51.989237+0100
 ios-dynamic-loading-framework[2962:109722]
 App started
2018-08-18 12:26:51.992187+0100
 ios-dynamic-loading-framework[2962:109722]
 Before referencing CASHello in DynamicFramework1
dlopen(DynamicFramework1.framework/DynamicFramework1, 0x00000001)
2018-08-18 12:26:52.002234+0100
 ios-dynamic-loading-framework[2962:109722]
 Loading CASHello in dynamic-framework-1
  dlopen(DynamicFramework1.framework/DynamicFramework1) ==>
   0x600000157ce0
2018-08-18 12:26:52.002398+0100
 ios-dynamic-loading-framework[2962:109722]
 Loaded CASHello in DynamicFramework1
dlclose(0x600000157ce0)
2018-08-18 12:26:52.002560+0100
 ios-dynamic-loading-framework[2962:109722]
 CASHello from DynamicFramework1 still loaded after dlclose()
2018-08-18 12:26:52.002642+0100
 ios-dynamic-loading-framework[2962:109722]
 Before referencing CASHello in DynamicFramework2
dlopen(DynamicFramework2.framework/DynamicFramework2, 0x00000001)
objc[2962]: Class CASHello is implemented in both
 /Users/faisalm/Library/
Developer/Xcode/DerivedData/
ios-dynamic-loading-framework-ednexaanxalgpudjcqeuejsdmhlq/Build
/Products/Debug-iphonesimulator/
DynamicFramework1.framework/DynamicFramework1 (0x1229cb178)
 and
 /Users/faisalm/Library/Developer/Xcode/DerivedData/
ios-dynamic-loading-framework-ednexaanxalgpudjcqeuejsdmhlq/Build
/Products/Debug-iphonesimulator/DynamicFramework2.framework/
DynamicFramework2
 (0x1229d3178).
 One of the two will be used. Which one is undefined.
2018-08-18 12:26:52.012601+0100
 ios-dynamic-loading-framework[2962:109722]
 Loading CASHello in dynamic-framework-2
  dlopen(DynamicFramework2.framework/DynamicFramework2) ==>
   0x600000157d90
2018-08-18 12:26:52.012792+0100
 ios-dynamic-loading-framework[2962:109722]
 Loaded CASHello in DynamicFramework2
dlclose(0x600000157d90)
2018-08-18 12:26:52.012921+0100
 ios-dynamic-loading-framework[2962:109722]
 CASHello from DynamicFramework2 still loaded after dlclose()
这是加载 DynamicFramework1的相关源代码。
-(void)loadCASHelloFromDynamicFramework1
{
    void *framework1Handle = dlopen(
      "DynamicFramework1.framework/DynamicFramework1", RTLD_LAZY);

    if (NSClassFromString(@"CASHello"))
    {
        NSLog(@"Loaded CASHello in DynamicFramework1");
    }
    else
    {
        NSLog(@"Could not load CASHello in DynamicFramework1");
    }

    dlclose(framework1Handle);

    if (NSClassFromString(@"CASHello"))
    {
        NSLog(
  @"CASHello from DynamicFramework1 still loaded after dlclose()"
        );
    }
    else
    {
        NSLog(@"Unloaded DynamicFramework1");
    }
}
这是在的 viewDidLoad 中调用它的代码:
- (void)viewDidLoad
{
    [super viewDidLoad];

    //Loading the first dynamic library here works fine :)
    NSLog(@"Before referencing CASHello in DynamicFramework1");
    [self loadCASHelloFromDynamicFramework1];

    /*
     Loading the second framework will give a message in
      the console saying that both classes will be loaded
      and referencing the class will result in undefined
      behavior.
    */

    NSLog(@"Before referencing CASHello in DynamicFramework2");
    [self loadCASHelloFromDynamicFramework2];
}
通常,如果我们的应用在运行任何代码之前就崩溃了,那么最好打开 Dynamic Loader 诊断选项。这可能是部署问题(未捆绑正确的库)或代码签名问题。
Jablotron 崩溃
Jablotron 程序是管理家庭中的警报和检测器的程序。
这是程序发生崩溃所产生的的崩溃报告,为了便于演示而被截断:
Incident Identifier: 732438C5-9E5A-48E7-95E2-76C800CDD6D9
CrashReporter Key:   181EC21F-295A-4D13-B14E-8BE1A7DFB5C7
Hardware Model:      iPhone3,1
Process:         MyJablotron_dev [177]
Path:            /var/mobile/Applications/
D3CC3D22-1B0F-4CAF-8F68-71AD3B211CD9/
MyJablotron_dev.app/MyJablotron_dev
Identifier:      net.jablonet.myjablotron.staging
Version:         3.3.0.14 (3.3.0.14)
Code Type:       ARM
Parent Process:  launchd [1]

Date/Time:       2016-05-24T07:59:56Z
Launch Time:     2016-05-24T07:57:08Z
OS Version:      iPhone OS 7.1.2 (11D257)
Report Version:  104

Exception Type:  SIGBUS
Exception Codes: BUS_ADRALN at 0xcd0b1c
Crashed Thread:  0

Thread 0 Crashed:
0   libswiftCore.dylib    0x011aed64 0xfba000 + 2051428
1   MyJablotron_dev       0x004e7c18 0xb2000 + 4414488
2   libswiftCore.dylib    0x011b007f 0xfba000 + 2056319
3   libswiftCore.dylib    0x011aff73 0xfba000 + 2056051
4   libswiftCore.dylib    0x011adf29 0xfba000 + 2047785
5   libswiftCore.dylib    0x011adf73 0xfba000 + 2047859
6   MyJablotron_dev       0x00614a6c
 type metadata accessor for
 MyJablotron.CDFM  MyJablotron.ChartDataPointStructureLegend>
   (ChartThermoPlotSpace.swift:0)
7   MyJablotron_dev                      0x00606698
 MyJablotron.ChartThermoPlotSpace.init ()
 MyJablotron.ChartThermoPlotSpace
  (ChartThermoPlotSpace.swift:206)
8   MyJablotron_dev
0x00606c60
 MyJablotron.ChartThermoPlotSpace.__allocating_init ()
 MyJablotron.ChartThermoPlotSpace
 (ChartThermoPlotSpace.swift:0)
9   MyJablotron_dev
0x0048825c
 MyJablotron.ChartBase.initWithThermometer
  (__ObjC.Thermometer)()
  (ChartBase.swift:139)
10  MyJablotron_dev                      0x00488034
 MyJablotron.ChartBase.initWithSegment (__ObjC.Segment)()
  (ChartBase.swift:123)
11  MyJablotron_dev                      0x0059186c
 MyJablotron.ChartViewController.setupSegment ()()
  (ChartViewController.swift:106)
12  MyJablotron_dev                      0x0058f374
 MyJablotron.ChartViewController.viewDidLoad ()()
  (ChartViewController.swift:39)
13  MyJablotron_dev                      0x0058f5a4
 @objc MyJablotron.ChartViewController.viewDidLoad ()()
  (ChartViewController.swift:0)
14  UIKit                                0x3227d4ab
 -[UIViewController loadViewIfRequired] + 516
15  UIKit                                0x3227d269
 -[UIViewController view] + 22
16  UIKit                                0x3240936b
 -[UINavigationController
 _startCustomTransition:] + 632
17  UIKit                                0x32326d63
 -[UINavigationController
  _startDeferredTransitionIfNeeded:] + 416
18  UIKit                                0x32326b6d
 -[UINavigationController
 __viewWillLayoutSubviews] + 42
19  UIKit                                0x32326b05
 -[UILayoutContainerView layoutSubviews] + 182
20  UIKit                                0x32278d59
 -[UIView(CALayerDelegate)
 layoutSublayersOfLayer:] + 378
21  QuartzCore                           0x31ef662b
 -[CALayer layoutSublayers] + 140
22  QuartzCore                           0x31ef1e3b
 CA::Layer::layout_if_needed(CA::Transaction*) + 348
23  QuartzCore                           0x31ef1ccd
 CA::Layer::layout_and_display_if_needed(CA::Transaction*) + 14
24  QuartzCore                           0x31ef16df
 CA::Context::commit_transaction(CA::Transaction*) + 228
25  QuartzCore                           0x31ef14ef
 CA::Transaction::commit() + 312
26  QuartzCore                           0x31eeb21d
 CA::Transaction::observer_callback(__CFRunLoopObserver*,
    unsigned long, void*) + 54
27  CoreFoundation                       0x2fa27255
__CFRUNLOOP_IS_CALLING_OUT_TO_AN_OBSERVER_CALLBACK_FUNCTION__
 + 18
28  CoreFoundation                       0x2fa24bf9
 __CFRunLoopDoObservers + 282
29  CoreFoundation                       0x2fa24f3b
 __CFRunLoopRun + 728
30  CoreFoundation                       0x2f98febf
 CFRunLoopRunSpecific + 520
31  CoreFoundation                       0x2f98fca3
 CFRunLoopRunInMode + 104
32  GraphicsServices                     0x34895663
 GSEventRunModal + 136
33  UIKit                                0x322dc14d
 UIApplicationMain + 1134
34  MyJablotron_dev                      0x002b0683
 main (main.m:16)
35  libdyld.dylib                        0x3a719ab7
 start + 0
我们可以看到崩溃发生在 Swift Core运行时库中。当我们看到 Apple 的通用代码崩溃时,通常表明滥用 API 。在这些情况下,我们希望看到一个描述性错误。
在此示例中,我们得到总线对齐错误。Apple 的库代码错误地访问了 CPU 架构的内存地址。
这令人惊喜。有时,当我们使用高级特性或设置编译器优化设置时,我们可能会在特殊情况或较少使用的代码路径中触发错误。
我们看到问题出在对象初始化期间:
6   MyJablotron_dev                      0x00614a6c
 type metadata accessor for
 MyJablotron.CDFM  MyJablotron.ChartDataPointStructureLegend>
   (ChartThermoPlotSpace.swift:0)
7   MyJablotron_dev                      0x00606698
 MyJablotron.ChartThermoPlotSpace.init ()
 MyJablotron.ChartThermoPlotSpace
  (ChartThermoPlotSpace.swift:206)
8   MyJablotron_dev                      0x00606c60
 MyJablotron.ChartThermoPlotSpace.__allocating_init ()
 MyJablotron.ChartThermoPlotSpace (ChartThermoPlotSpace.swift:0)
“元数据访问器”短语很有趣,因为它暗示我们正在运行编译器生成的代码,而不是我们直接编写的代码。也许,作为一种解决方法,我们可以简化代码以使用更简单的语言功能。
在这里,我们的目标是通过采用ChartThermoPlotSpace类并简化它来编写一个简单的测试用例,直到找到发生崩溃的必要代码为止。
苹果通过更新其编译器来纠正 Swift Generics 错误,从而解决了该崩溃问题。


 972
972


 被折叠的 条评论
为什么被折叠?
被折叠的 条评论
为什么被折叠?
 到【灌水乐园】发言


