


 本文介绍如何使用Python的sklearn库中的线性回归算法来预测儿童的身高。通过考虑年龄、性别及家族成员的身高数据进行训练,并展示了预测结果。
Python+sklearn使用线性回归算法预测儿童身高
In [1]:
import copy
import numpy as np
from sklearn import linear_model
def linearRegressionPredict(x, y):
lr = linear_model.LinearRegression()
# 拟合
lr.fit(x, y)
return lr
# 儿童年龄,性别(0女1男),父亲身高,母亲身高,祖父身高,祖母身高,外祖父身高,外祖母身高
x = np.array([[1, 0, 180, 165, 175, 165, 170, 165],\
[3, 0, 180, 165, 175, 165, 173, 165],\
[4, 0, 180, 165, 175, 165, 170, 165],\
[6, 0, 180, 165, 175, 165, 170, 165],\
[8, 1, 180, 165, 175, 167, 170, 165],\
[10, 0, 180, 166, 175, 165, 170, 165],\
[11, 0, 180, 165, 175, 165, 170, 165],\
[12, 0, 180, 165, 175, 165, 170, 165],\
[13, 1, 180, 165, 175, 165, 170, 165],\
[14, 0, 180, 165, 175, 165, 170, 165],\
[17, 0, 170, 165, 175, 165, 170, 165]])
# 儿童身高,单位:cm
y = np.array([60, 90, 100, 110,\
130, 140, 150, 164,\
160, 163, 168])
# 根据已知数据拟合最佳直线的系数和截距
lr = linearRegressionPredict(x, y)
# 查看最佳拟合系数
print('k:', lr.coef_)
k: [ 8.03076923e+00 -4.65384615e+00 2.87769231e+00 -5.61538462e-01
1.33226763e-15 5.07692308e+00 1.88461538e+00 0.00000000e+00]
In [2]:
# 截距
print('b:', lr.intercept_)
b: -1523.1538461538462
In [3]:
import matplotlib.pyplot as plt
In [23]:
x.take(0,axis =1)
Out[23]:
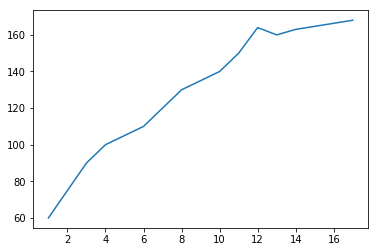
array([ 1, 3, 4, 6, 8, 10, 11, 12, 13, 14, 17])
In [24]:
plt.plot(x.take(0,axis =1),y)
Out[24]:
[]
In [23]:
# 预测
xs = np.array([[10, 0, 180, 165, 175, 165, 170, 165],\
[17, 1, 173, 153, 175, 161, 170, 161],\
[34, 0, 170, 165, 170, 165, 170, 165]])
for item in xs:
# 深复制,假设超过18岁以后就不再长高了
item1 = copy.deepcopy(item)
if item1[0] > 18:
item1[0] = 18
print(item, ':', lr.predict(item1.reshape(1,-1)))
[ 10 0 180 165 175 165 170 165] : [140.56153846]
[ 17 1 173 153 175 161 170 161] : [158.41]
[ 34 0 170 165 170 165 170 165] : [176.03076923]
In [35]:
x[:][0]
Out[35]:
array([ 1, 0, 180, 165, 175, 165, 170, 165])


 被折叠的 条评论
为什么被折叠?
被折叠的 条评论
为什么被折叠?
 到【灌水乐园】发言


