


利用plt.hist()
importmatplotlib.pylab as plt%matplotlib inline
plt.figure(figsize=(21, 12))
plt.hist(x, bins=50)#plt.hist(df['title'].apply(lambda x: len(x)), bins=50)
plt.grid()
plt.savefig('distribution.png')
模块化:
def plot_data_distribution(value_list, figsize=(21, 12), bins=50, fout=None):
plt.figure(figsize=figsize)
plt.hist(value_list, bins=bins)
plt.xticks(range(int(max(value_list)-min(value_list))))#plt.xticks([i * 0.01 for i in range(0, 110, 5)])
#plt.xticks([0.1 * x for x in range(11)])
#plt.xlim(0, 1)
plt.grid()iffout:
plt.savefig(fout)else:
plt.show()
把多个数据分布显示在一个直方图表中对比:
def plot_multi_data_distribution(value_list1, value_list2, figsize=(21, 12), bins=50, fout=None):
plt.figure(figsize=figsize)
plt.hist([value_list1, value_list2], bins=bins, color=["r", "b"], label=["value_list1", "value_list2"])#plt.xticks(range(int(max(value_list) - min(value_list))))
plt.grid()
plt.legend(loc=1)
plt.xlabel("probability")
plt.ylabel("count")
plt.title("data distribution")iffout:
plt.savefig(fout)else:
plt.show()
defgen_colors(num):#colors = ["blue", "red", "green", "black", "brown", "orange", "gray", "purple", "salmon", "hotpink",
#"#222222", "#444444", "#666666", "#888888", "#AAAAAA", "#CCCCCC", "#EEEEEE",
#"#111111", "#333333", "#555555", "#777777", "#999999"]
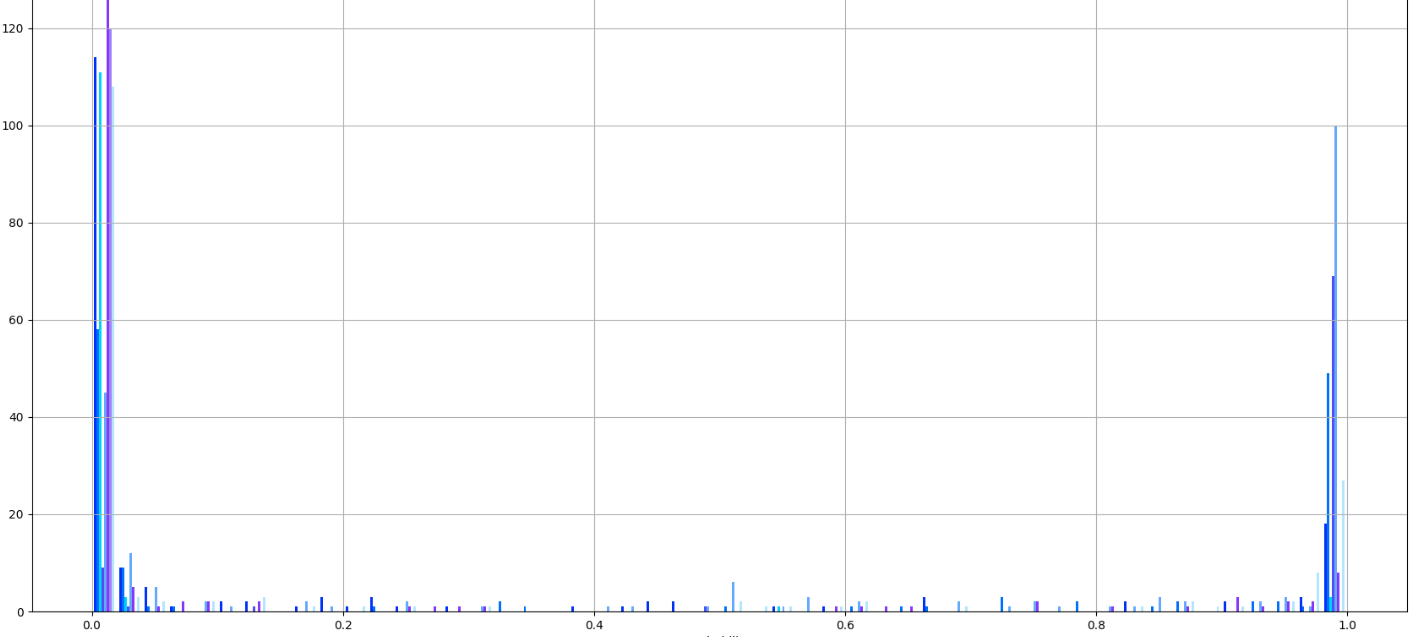
colors = ["black", "darkgrey", "red", "darkorange", "brown", "darkgoldenrod", "yellow", "lightgreen", "green", "lime","cyan", "deepskyblue", "dodgerblue", "cornflowerblue", "blue", "purple", "fuchsia", "lightpink"]returncolors[:num]def plot_multi_data_distribution(value_lists, names, figsize=(21, 12), bins=50, fout=None):
plt.figure(figsize=figsize)
plt.hist(value_lists, bins=bins, color=gen_colors(num=len(value_lists)), label=names)#plt.xticks(range(int(max(value_list) - min(value_list))))
plt.xticks([i * 0.01 for i in range(0, 110, 5)])
plt.grid()
plt.legend(loc=1)
plt.xlabel("probability")
plt.ylabel("count")
plt.title("data distribution")iffout:
plt.savefig(fout)else:
plt.show()
生成渐变色:
def gen_colors(num, base_color="#1000FF", interval=1600000):
base= int(base_color.replace("#", "0x"), 16)#return ["blue", "red", "green", "black", "brown", "orange", "gray", "purple", "hotpink", "salmon"][:num]
#return ["#0000FF", "#00FF00", "#FF0000", "#00FFFF", "#FF00FF", "#FFFF00", "#000000",
#"#666666", "#660000", "#666600", "#660066"][:num]
return ["#" + hex(base + (i * interval))[2:] for i in range(num)]
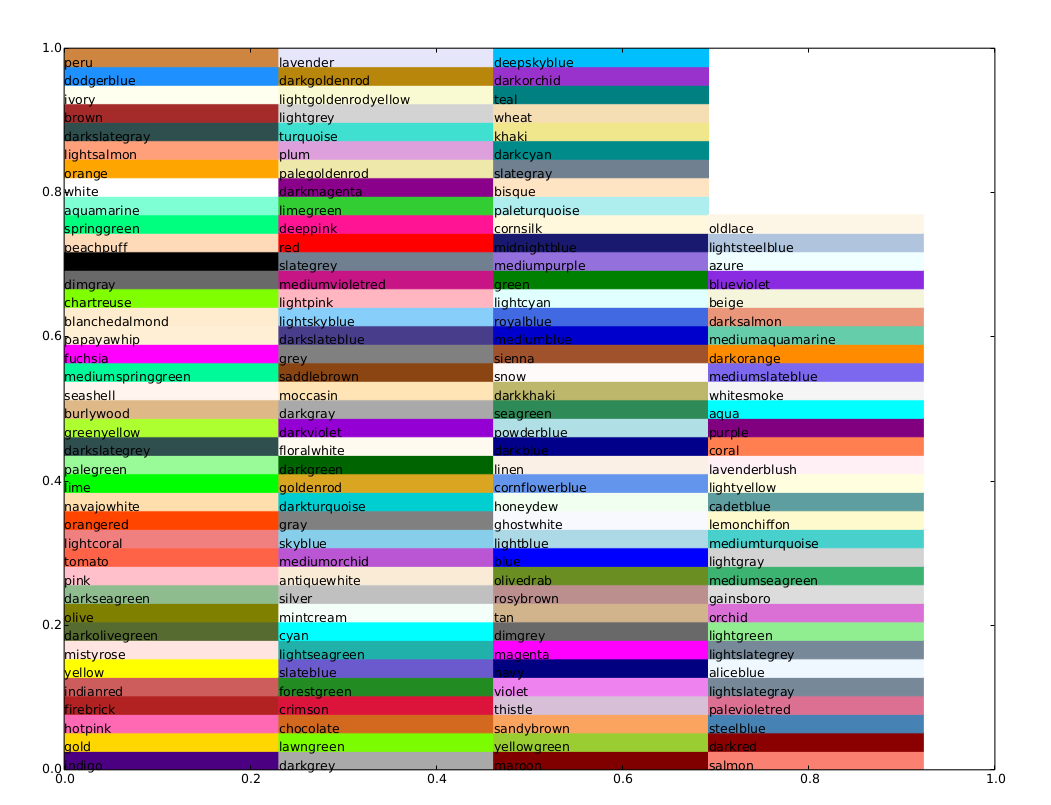
例如下面这种(看到眼花哈哈哈):
还是选择几种比较特别的颜色会方便看一些.
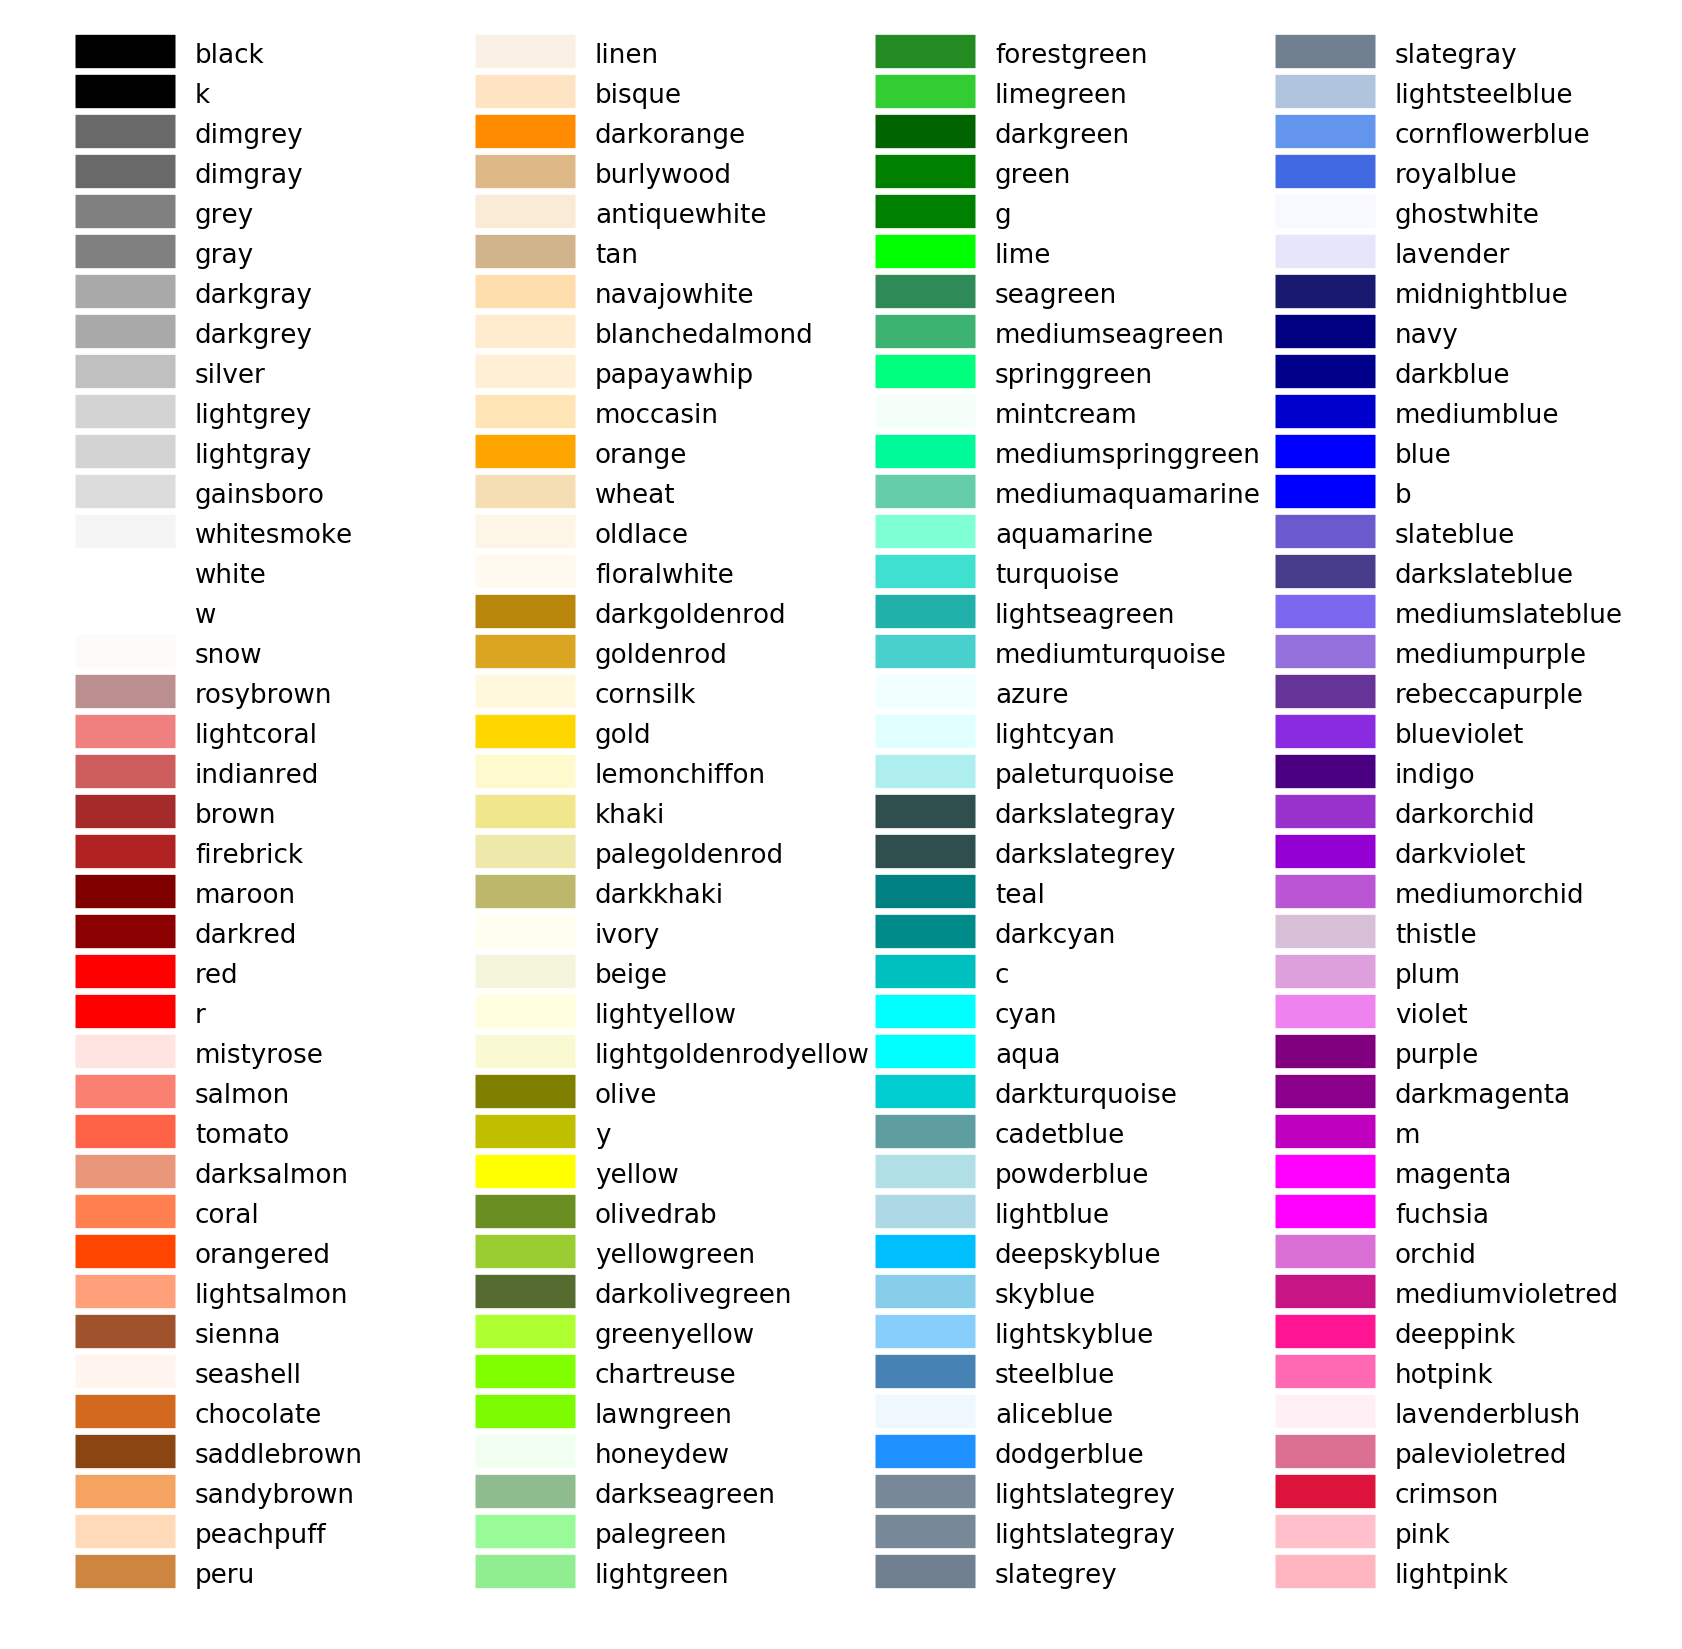
Matplotlib uses a dictionary from its colors.py module. To print the names use:
#python2:
importmatplotlibfor name, hex inmatplotlib.colors.cnames.iteritems():print(name, hex)#python3:
importmatplotlibfor name, hex inmatplotlib.colors.cnames.items():print(name, hex)
This is the complete dictionary:
cnames ={'aliceblue': '#F0F8FF','antiquewhite': '#FAEBD7','aqua': '#00FFFF','aquamarine': '#7FFFD4','azure': '#F0FFFF','beige': '#F5F5DC','bisque': '#FFE4C4','black': '#000000','blanchedalmond': '#FFEBCD','blue': '#0000FF','blueviolet': '#8A2BE2','brown': '#A52A2A','burlywood': '#DEB887','cadetblue': '#5F9EA0','chartreuse': '#7FFF00','chocolate': '#D2691E','coral': '#FF7F50','cornflowerblue': '#6495ED','cornsilk': '#FFF8DC','crimson': '#DC143C','cyan': '#00FFFF','darkblue': '#00008B','darkcyan': '#008B8B','darkgoldenrod': '#B8860B','darkgray': '#A9A9A9','darkgreen': '#006400','darkkhaki': '#BDB76B','darkmagenta': '#8B008B','darkolivegreen': '#556B2F','darkorange': '#FF8C00','darkorchid': '#9932CC','darkred': '#8B0000','darksalmon': '#E9967A','darkseagreen': '#8FBC8F','darkslateblue': '#483D8B','darkslategray': '#2F4F4F','darkturquoise': '#00CED1','darkviolet': '#9400D3','deeppink': '#FF1493','deepskyblue': '#00BFFF','dimgray': '#696969','dodgerblue': '#1E90FF','firebrick': '#B22222','floralwhite': '#FFFAF0','forestgreen': '#228B22','fuchsia': '#FF00FF','gainsboro': '#DCDCDC','ghostwhite': '#F8F8FF','gold': '#FFD700','goldenrod': '#DAA520','gray': '#808080','green': '#008000','greenyellow': '#ADFF2F','honeydew': '#F0FFF0','hotpink': '#FF69B4','indianred': '#CD5C5C','indigo': '#4B0082','ivory': '#FFFFF0','khaki': '#F0E68C','lavender': '#E6E6FA','lavenderblush': '#FFF0F5','lawngreen': '#7CFC00','lemonchiffon': '#FFFACD','lightblue': '#ADD8E6','lightcoral': '#F08080','lightcyan': '#E0FFFF','lightgoldenrodyellow': '#FAFAD2','lightgreen': '#90EE90','lightgray': '#D3D3D3','lightpink': '#FFB6C1','lightsalmon': '#FFA07A','lightseagreen': '#20B2AA','lightskyblue': '#87CEFA','lightslategray': '#778899','lightsteelblue': '#B0C4DE','lightyellow': '#FFFFE0','lime': '#00FF00','limegreen': '#32CD32','linen': '#FAF0E6','magenta': '#FF00FF','maroon': '#800000','mediumaquamarine': '#66CDAA','mediumblue': '#0000CD','mediumorchid': '#BA55D3','mediumpurple': '#9370DB','mediumseagreen': '#3CB371','mediumslateblue': '#7B68EE','mediumspringgreen': '#00FA9A','mediumturquoise': '#48D1CC','mediumvioletred': '#C71585','midnightblue': '#191970','mintcream': '#F5FFFA','mistyrose': '#FFE4E1','moccasin': '#FFE4B5','navajowhite': '#FFDEAD','navy': '#000080','oldlace': '#FDF5E6','olive': '#808000','olivedrab': '#6B8E23','orange': '#FFA500','orangered': '#FF4500','orchid': '#DA70D6','palegoldenrod': '#EEE8AA','palegreen': '#98FB98','paleturquoise': '#AFEEEE','palevioletred': '#DB7093','papayawhip': '#FFEFD5','peachpuff': '#FFDAB9','peru': '#CD853F','pink': '#FFC0CB','plum': '#DDA0DD','powderblue': '#B0E0E6','purple': '#800080','red': '#FF0000','rosybrown': '#BC8F8F','royalblue': '#4169E1','saddlebrown': '#8B4513','salmon': '#FA8072','sandybrown': '#FAA460','seagreen': '#2E8B57','seashell': '#FFF5EE','sienna': '#A0522D','silver': '#C0C0C0','skyblue': '#87CEEB','slateblue': '#6A5ACD','slategray': '#708090','snow': '#FFFAFA','springgreen': '#00FF7F','steelblue': '#4682B4','tan': '#D2B48C','teal': '#008080','thistle': '#D8BFD8','tomato': '#FF6347','turquoise': '#40E0D0','violet': '#EE82EE','wheat': '#F5DEB3','white': '#FFFFFF','whitesmoke': '#F5F5F5','yellow': '#FFFF00','yellowgreen': '#9ACD32'}
上面对应的颜色:
另外的显示方式:
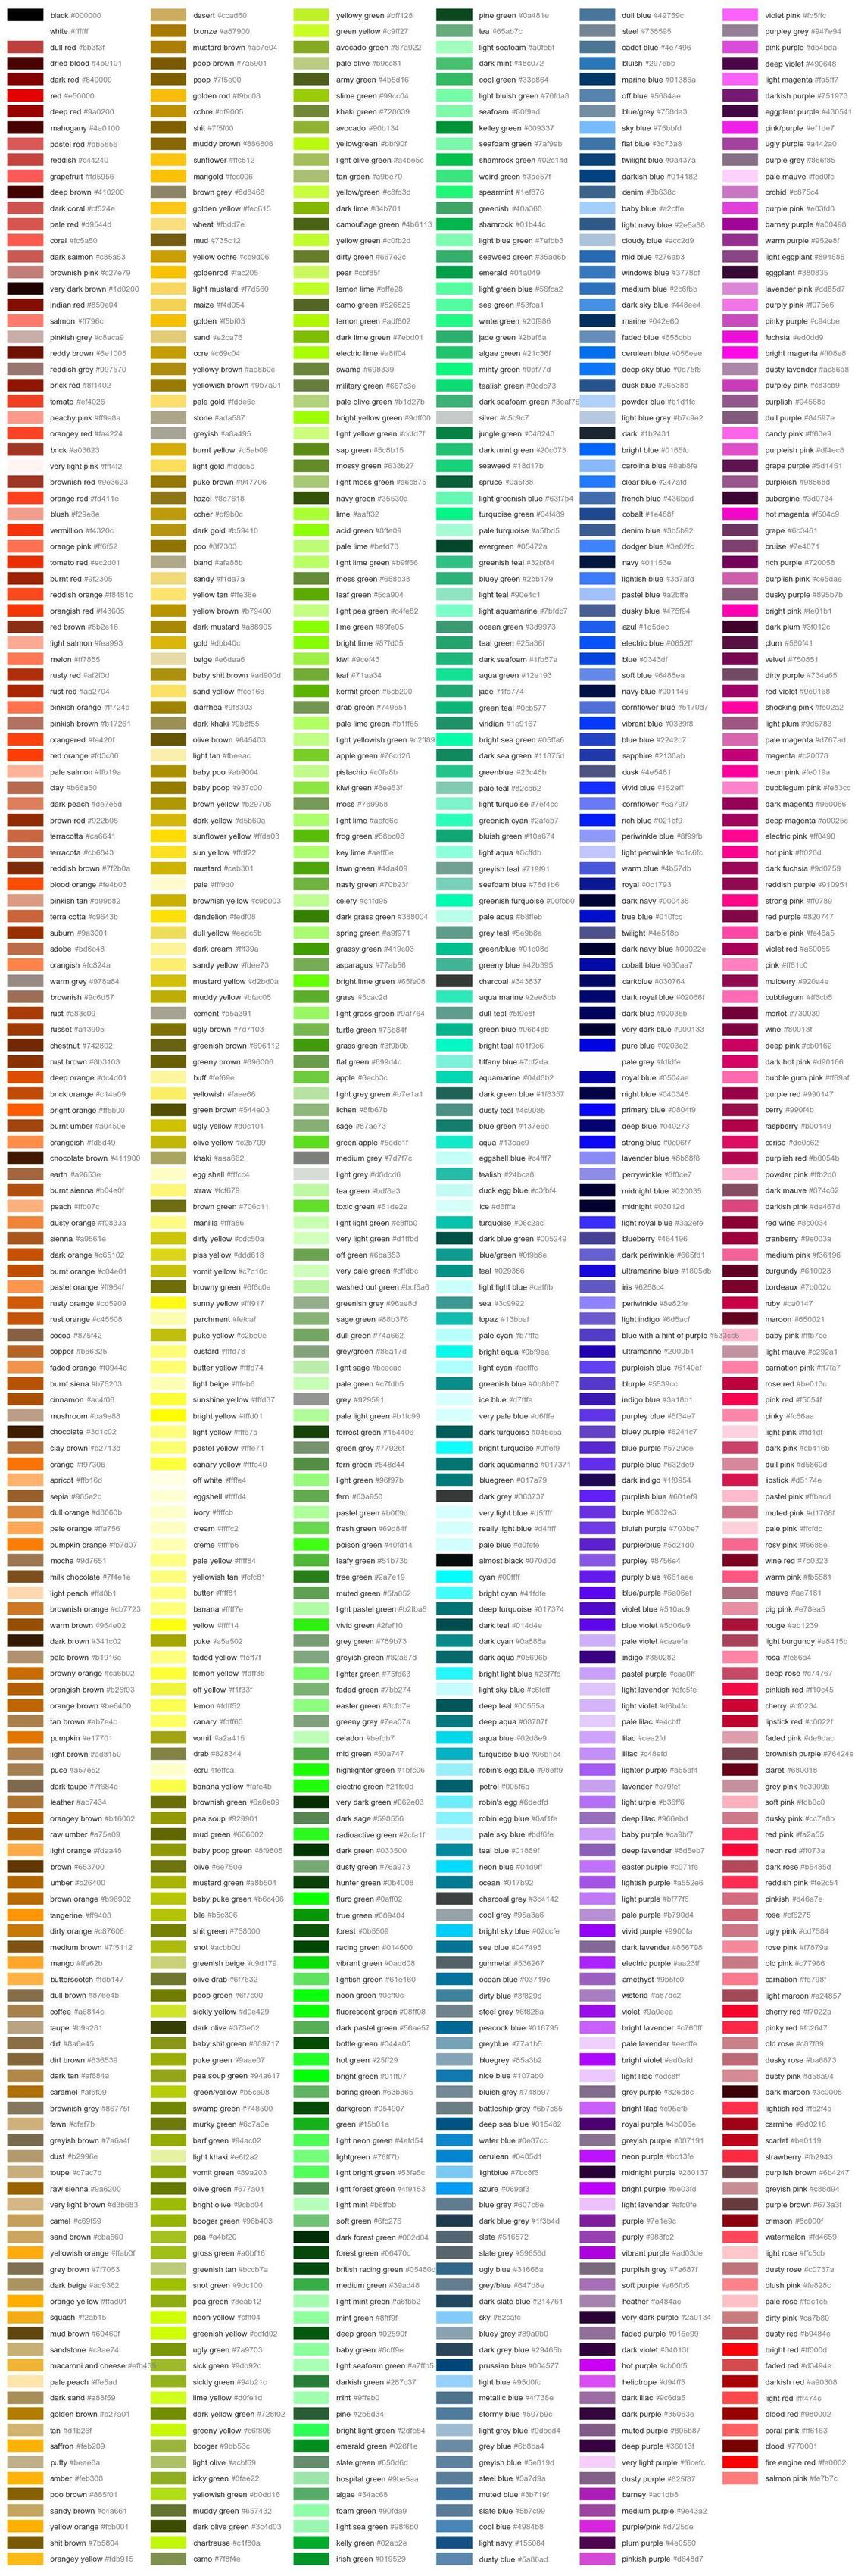
装了seaborn扩展的话,在字典seaborn.xkcd_rgb中包含所有的xkcd crowdsourced color names。如下:
plt.plot([1,2], lw=4, c=seaborn.xkcd_rgb['baby poop green'])
所有颜色如下:
更多详细参考:


 1万+
1万+


 被折叠的 条评论
为什么被折叠?
被折叠的 条评论
为什么被折叠?
 到【灌水乐园】发言


