


Golang提供了强大的代码性能分析工具PProf,能够非常方便的监控代码运行性能。性能分析可以采用命令行方式 go tool pprof 同时也提供直观的http可视化方式,非常方便。
数据采集
性能分析基础数据的获取有三种方式:
1> runtime/pprof 包
2> net/http/pprof 包
3> go test 时添加收集参数
runtime/pprof 包的使用[不推荐使用]
针对于应用程序,通过命令行的启动参数来生成prof文件,再使用go tool pprof工具进行分析,如
Go
1
2
3
4
5
6
7
8
9
10
11
12
13
14
15
16
17
18
19
20
21
22
23
24
25
26
27
28
29
30
31
32
33
34
35
36
37
38
39
packagemain
import(
// "flag"
// "log"
// "os"
"runtime/pprof"
)
varcpuprofile=flag.String("cpuprofile","","write cpu profile to file")
funcmain(){
flag.Parse()
if*cpuprofile!=""{
f,err:=os.Create(*cpuprofile)
// if err != nil {
// log.Fatal(err)
// }
err=pprof.StartCPUProfile(f)
// if err != nil {
// log.Fatal(err)
// }
deferpprof.StopCPUProfile()
}
// for {
// Add("test")
// }
}
// func Add(str string) string {
// data := []byte(str)
// sData := string(data)
// var sum = 0
// for i := 0; i < 10000; i++ {
// sum += i
// }
// return sData
// }
运行 ./app.exe -cpuprofile=cpu.prof
分析 go tool pprof cpu.prof
注意,实际测试时得到的cpu.prof文件总是为空,原因未知
net/http/pprof 包的使用[推荐]
net/http/pprof 对 runtime/pprof 进行了封装,并在http端口上暴露出来,入口为 IP:PORT/debug/pprof/
a>若应用为web服务器,只需引入包即可 _ "net/http/pprof",会自动注册路由到/debug/pprof/
b>若为服务时程,可开启一个goroutine开启端口并监听,如
go func(){log.Println(http.ListenAndServe(":8080",nil))}()
Go
1
2
3
4
5
6
7
8
9
10
11
12
13
14
15
16
17
18
19
20
21
22
23
24
25
26
27
28
29
packagemain
import(
"log"
"net/http"
_"net/http/pprof"
)
funcmain(){
// 性能分析
gofunc(){
log.Println(http.ListenAndServe(":8080",nil))
}()
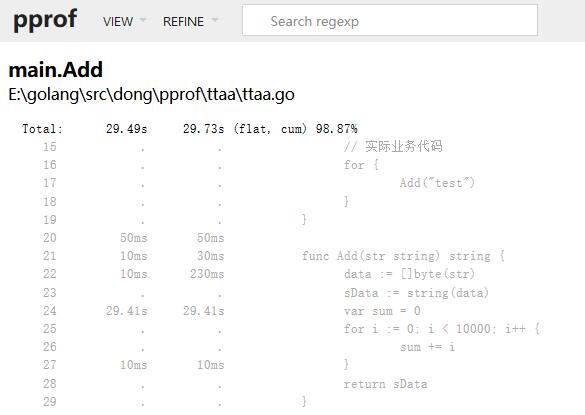
// 实际业务代码
for{
Add("test")
}
}
funcAdd(strstring)string{
data:=[]byte(str)
sData:=string(data)
varsum=0
fori:=0;i<10000;i++{
sum+=i
}
returnsData
}
访问 http://127.0.0.1:8080/debug/pprof/ 即可实时查看性能数据,业面如下:
Vim
1
2
3
4
5
6
7
8
9
10
11
12
13
14
/debug/pprof/
Typesofprofilesavailable:
CountProfile
2allocs#所有过去内存分析采样
0block#导致同步原语阻塞的堆栈跟踪
0cmdline#程序启动参数
4goroutine#所有当前goroutine堆栈跟踪
2heap#活动对象内存分配采样
0mutex#互斥锁跟踪
0profile#生成cpuprofile文件生成文件使用gotoolpprof工具分析
8threadcreate#创建系统线程的堆栈跟踪
0trace#对当前程序执行的跟踪生成文件使用gotooltrace工具分析
fullgoroutinestackdump#显示所有goroutine的堆栈
其中 go tool trace 工具会打开 http://127.0.0.1:1089/ 通过网页方式显示结果
Vim
1
2
3
4
5
6
7
8
Viewtrace#视图跟踪
Goroutineanalysis
Networkblockingprofile
Synchronizationblockingprofile#同步阻塞
Syscallblockingprofile
Schedulerlatencyprofile#调度延迟
User-definedtasks
User-definedregions
go test 时添加收集参数
需要创建测试文件
go test支持的参数非常多,如
-cpuprofile=cpu.prof
-memprofile=mem.prof
数据分析
命令行方式
对生成的profile文件,可使用go tool pprof profilename来分析,如
Python
1
2
3
4
5
6
7
8
9
10
11
12
13
14
15
16
gotoolpprofC:\Users\ddonl\Desktop\profile
Type:cpu
Time:Feb18,2019at11:36am(CST)
Duration:30.13s,Totalsamples=29.89s(99.20%)
Enteringinteractivemode(type"help"forcommands,"o"foroptions)
(pprof)top5
Showingnodesaccountingfor29.43s,98.46%of29.89stotal
Dropped32nodes(cum<=0.15s)
Showingtop5nodesoutof9
flatflat%sum%cumcum%
29.18s97.62%97.62%29.52s98.76%main.Add
0.13s0.43%98.06%0.24s0.8%runtime.mallocgc
0.05s0.17%98.23%0.27s0.9%runtime.newstack
0.04s0.13%98.36%0.29s0.97%runtime.slicebytetostring
0.03s0.1%98.46%29.55s98.86%main.main
(pprof)
常用的命令还有:
go tool pprof http://localhost:8080/debug/pprof/profile 默认采集需要30秒
go tool pprof http://localhost:8080/debug/pprof/heap
go tool pprof http://localhost:8080/debug/pprof/block
go tool pprof http://localhost:8080/debug/pprof/mutex
web可视化方式
在 go tool pprof 下输入 web 命令,注意默认端口为8080
go tool pprof -http=:8000 http://localhost:8080/debug/pprof/heap 查看内存使用
go tool pprof -http=:8000 http://localhost:8080/debug/pprof/profile 查看cpu占用
注意,需要提前安装 Graphviz 用于画图
下载地址:https://graphviz.gitlab.io/download/
windows:https://graphviz.gitlab.io/_pages/Download/windows/graphviz-2.38.zip
解压下,添加环境变量 Path下添加 C:\Go\graphviz\bin (这里我解压在 C:\Go\graphviz 目录)
测试:命令提示符下 dot -V # 打印版本信息
若是Linux,yum install graphviz # 默认安装版本为为2.30 依赖项较多
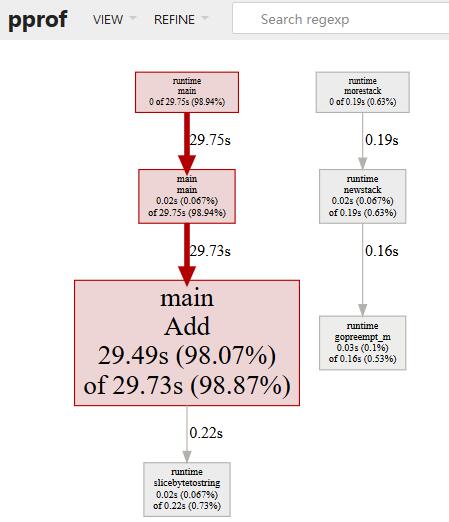
访问地址:http://localhost:8000/ui/
图形视图:面积超大,代表时间越长
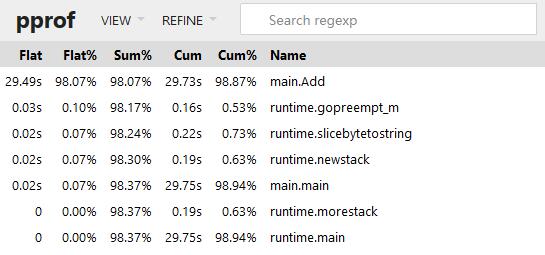
top 视图:
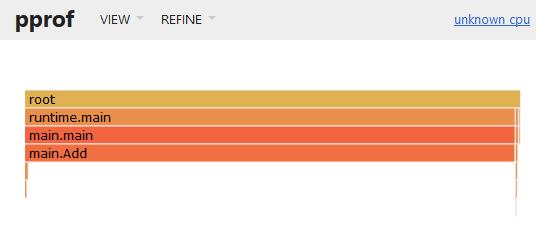
火焰图:
Peek:
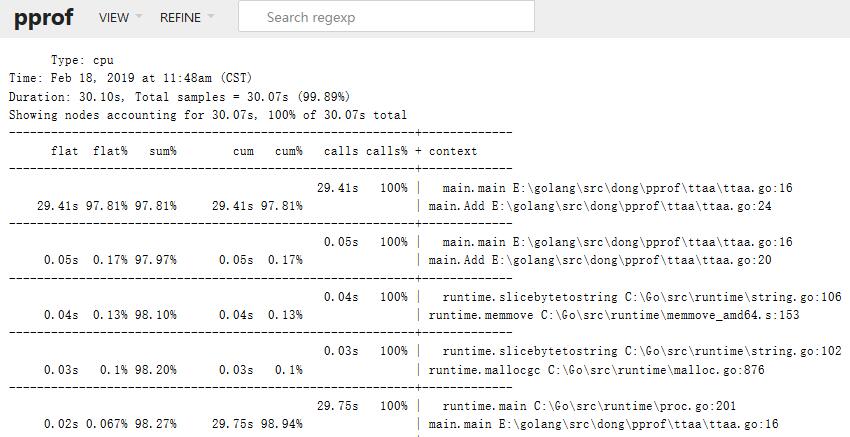
代码视图:
简易指标输出 expvar
Go
1
2
3
4
5
6
7
8
9
10
11
12
13
14
15
16
17
18
19
20
21
22
23
24
25
26
27
28
29
30
31
32
33
34
35
36
37
38
39
40
41
42
43
44
45
46
47
48
49
50
51
52
53
54
55
56
57
58
packagemain
import(
"encoding/json"
//"expvar"
//"net/http"
"fmt"
"runtime"
"time"
)
typeMonitorstruct{
Allocuint64`json:"堆内存"`// 堆内存字节分配数
TotalAllocuint64`json:"最大堆内存"`// 堆中分配最大字节数
Sysuint64`json:"系统内存"`// 从系统中获得的总内存
Mallocsuint64`json:"分配对象"`// 分配对象数
Freesuint64`json:"释放对象"`// 释放对象数
LiveObjectsuint64`json:"存活对象"`// 存活对象数
PauseTotalNsuint64`json:"GC时间"`// 总GC暂停时间
NumGCuint32`json:"GC次数"`
NumGoroutineint`json:"协程数"`// goroutine数量
}
funcNewMonitor(durationint){
varmMonitor
varrtmruntime.MemStats
varinterval=time.Duration(duration)*time.Second
//var goroutines = expvar.NewInt("num_goroutine")
for{
// 读取内存状态信息
runtime.ReadMemStats(&rtm)
m.NumGoroutine=runtime.NumGoroutine()
//goroutines.Set(int64(m.NumGoroutine))
m.Alloc=rtm.Alloc
m.TotalAlloc=rtm.TotalAlloc
m.Sys=rtm.Sys
m.Mallocs=rtm.Mallocs
m.Frees=rtm.Frees
m.LiveObjects=m.Mallocs-m.Frees
m.PauseTotalNs=rtm.PauseTotalNs
m.NumGC=rtm.NumGC
b,_:=json.Marshal(m)
fmt.Println(string(b))
}
}
funcmain(){
goNewMonitor(1)// 性能数据
select{}// 业务逻辑
//http.ListenAndServe(":8080", nil)
}
在正常程序中,添加 go NewMonitor(1) 每隔指定时间在控制台输出性能数据
此外,内置包 expvar 可以在/debug/vars 中输出cmdline、memstats的json数据,若要向其中添加输出内容,如输出 num_goroutine 用于显示协程数量,核心语句如下:
import "expvar"
var goroutines = expvar.NewInt("num_goroutine")
goroutines.Set(int64(m.NumGoroutine))
Go GC监控
方式1:GODEBUG=gctrace=1
go build -o main
GODEBUG=gctrace=1 ./main
方式2:go tool trace
在代码中添加:
f, _ := os.Create("trace.out")
defer f.Close()
trace.Start(f)
defer trace.Stop()
然后运行程序,等程序运行完成,执行以下命令
go tool trace trace.out
# 需要等到程序执行完成 需要使用chrome浏览器(实测firefox有问题)
方式3:debug.ReadGCStats
方式4:runtime.ReadMemStats
Shell
1
2
3
4
5
6
7
8
9
10
11
12
13
14
15
16
17
18
19
20
21
22
23
24
25
26
27
28
29
30
31
32
33
34
35
36
37
38
39
40
41
42
43
44
45
46
47
48
49
50
51
52
53
54
55
56
57
58
59
packagemain
import(
//"os"
//"runtime/trace"
"fmt"
"runtime"
"runtime/debug"
"time"
)
funcallocate(){
_=make([]byte,1<<20)
}
//以代码的方式实现对感兴趣指标的监控
funcprintGCStats(){
t:=time.NewTicker(time.Second)
s:=debug.GCStats{}
for{
select{
case
debug.ReadGCStats(&s)
fmt.Printf("gc %d last@%v, PauseTotal %v\n",s.NumGC,s.LastGC,s.PauseTotal)
}
}
}
//直接通过运行时的内存相关的API进行监控
funcprintMemStats(){
t:=time.NewTicker(time.Second)
s:=runtime.MemStats{}
for{
select{
case
runtime.ReadMemStats(&s)
fmt.Printf("gc %d last@%v, next_heap_size@%vMB\n",s.NumGC,time.Unix(int64(time.Duration(s.LastGC).Seconds()),0),s.NextGC/(1<<20))
}
}
}
funcmain(){
//方式2:gotooltrace
//f,_:=os.Create("trace.out")
//deferf.Close()
//trace.Start(f)
//defertrace.Stop()
//方式3:debug.ReadGCStats
//goprintGCStats()
//方式4:runtime.ReadMemStats
goprintMemStats()
forn:=1;n<10000;n++{
allocate()
}
}
喜欢 (8)or分享 (0)


 636
636


 被折叠的 条评论
为什么被折叠?
被折叠的 条评论
为什么被折叠?
 到【灌水乐园】发言


