


CSV文件格式
CSV文件格式是逗号分隔值(Comma-Separated Values,CSV,有时也称为字符分隔值,因为分隔字符也可以不是逗号),其文件以纯文本形式存储表格数据(数字和文本).
datetime模块
因为csv格式文件中含有日期格式, 我们使用datetime模块来解析.
datetime模块中strptime函数可根据接受的实参规则来解析日期
from datetime import datetime
first_date = datetime.strptime('2020-10-22 18:32:30', '%Y-%m-%d %H:%M:%S')
print(first_date)
测试结果:
2020-10-22 18:32:30
模块datetime中设置日期和时间格式的实参
| 实参 | 含义 |
|---|---|
| %A | 星期的名称, 如Monday |
| %B | 月份名, 如January |
| %m | 用数字表示的月份(01~12) |
| %d | 用数字表示月份中的一天(01~31) |
| %Y | 四位年份, 如2020 |
| %y | 两位年份, 如20 |
| %H | 24小时制的小时数(00~23) |
| %I | 12小时制的小时数(01~12) |
| %p | am或pm |
| %M | 分钟数(00~59) |
| %S | 秒数(00~60) |
使用csv模块处理文件
代码中使用到csv文件, 本文末尾有下载链接
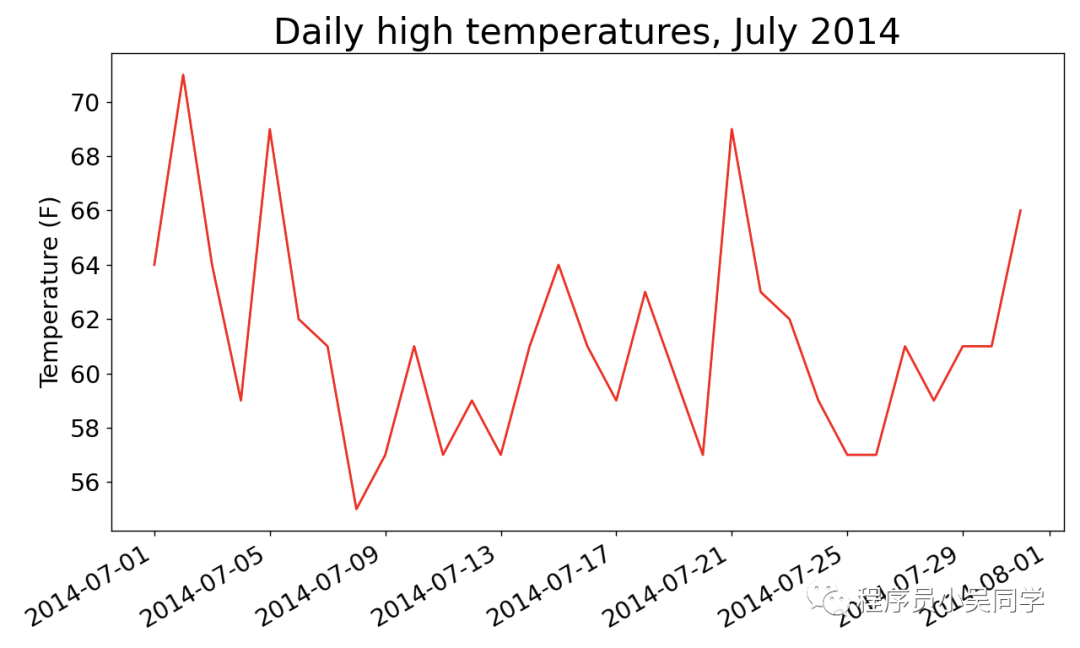
分析sitkaweather07-2014.csv文件
highs_lows.py
import csv
from datetime import datetime
from matplotlib import pyplot as plt
# 从文件中获取每天的最高温度
filename = 'sitka_weather_07-2014.csv'
with open(filename) as f:
reader = csv.reader(f)
# next(reader)函数是返回reader阅读器的下一行,目前只调用了一次,所以是头行
header_row = next(reader)
# 打印头行,header_row它是一个列表
# print(header_row)
# enumerate() 获取每个元素的索引及其值
for index, column_header in enumerate(header_row):
print(index, column_header)
# 第二列每天的最高温度
dates, highs = [], []
for row in reader:
current_date = datetime.strptime(row[0], '%Y-%m-%d')
print(current_date)
dates.append(current_date)
high = int(row[1])
highs.append(high)
print(dates)
print(highs)
# 根据数据绘制图形
fig = plt.figure(dpi=128, figsize=(10, 6))
plt.plot(dates, highs, c='red')
# 设置图形的格式
plt.title("Daily high temperatures, July 2014", fontsize=24)
plt.xlabel("", fontsize=16)
# 绘制斜的日期标签
fig.autofmt_xdate()
plt.ylabel("Temperature (F)", fontsize=16)
plt.tick_params(axis='both', which='major', labelsize=16)
plt.show()
提取文件的数据生成可视化图表:
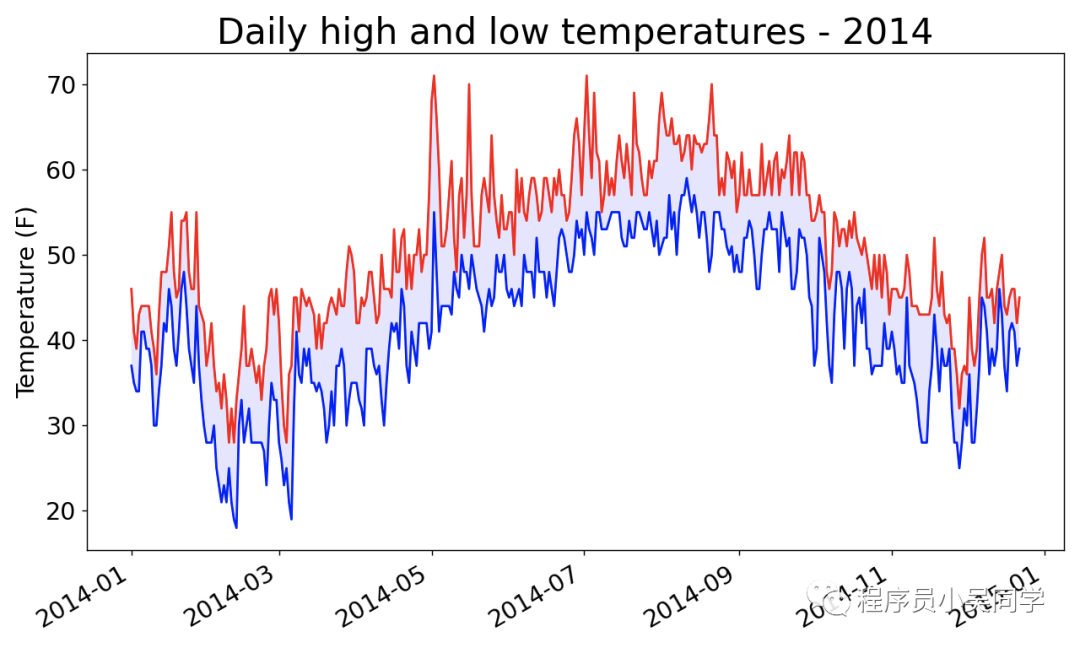
上面是一个月的天气数据分析, 下面试着分析更复杂的天气图
分析sitkaweather2014.csv
highs_lows2.py
import csv
from datetime import datetime
from matplotlib import pyplot as plt
# 从文件中获取每天的最高温度
filename = 'sitka_weather_2014.csv'
with open(filename) as f:
reader = csv.reader(f)
# next(reader)函数是返回reader阅读器的下一行,目前只调用了一次,所以是头行
header_row = next(reader)
# 打印头行,header_row它是一个列表
# print(header_row)
# enumerate() 获取每个元素的索引及其值
for index, column_header in enumerate(header_row):
print(index, column_header)
# 第二列每天的最高温度
dates, highs, lows = [], [], []
for row in reader:
current_date = datetime.strptime(row[0], '%Y-%m-%d')
print(current_date)
dates.append(current_date)
high = int(row[1])
highs.append(high)
low = int(row[3])
lows.append(low)
print(dates)
print(highs)
# 根据数据绘制图形
fig = plt.figure(dpi=128, figsize=(10, 6))
plt.plot(dates, highs, c='red')
plt.plot(dates, lows, c='blue')
# facecolor指定填充区域的颜色
plt.fill_between(dates, highs, lows, facecolor='blue', alpha=0.1)
# 设置图形的格式
plt.title("Daily high and low temperatures - 2014", fontsize=24)
plt.xlabel("", fontsize=16)
# 绘制斜的日期标签
fig.autofmt_xdate()
plt.ylabel("Temperature (F)", fontsize=16)
plt.tick_params(axis='both', which='major', labelsize=16)
plt.show()
提取文件的数据生成可视化图表:
在上面代码中, 有一处代码 high=int(row[1])当row[1]所在位置是没有数据时或者数据类型不对, 当使用int()转换就会报ValueError, 如下面这种报错.
Traceback (most recent call last):
File "/Users/wushanghui/Documents/code/codechina/python3-learn/csv/highs_lows3.py", line 25, in
high = int(row[1])
ValueError: invalid literal for int() with base 10: ''
下面看怎么避免这种问题.
分析deathvalley2014.csv
highs_lows3.py
import csv
from datetime import datetime
from matplotlib import pyplot as plt
# 从文件中获取每天的最高温度
filename = 'death_valley_2014.csv'
with open(filename) as f:
reader = csv.reader(f)
# next(reader)函数是返回reader阅读器的下一行,目前只调用了一次,所以是头行
header_row = next(reader)
# 打印头行,header_row它是一个列表
# print(header_row)
# enumerate() 获取每个元素的索引及其值
for index, column_header in enumerate(header_row):
print(index, column_header)
# 第二列每天的最高温度
dates, highs, lows = [], [], []
for row in reader:
try:
current_date = datetime.strptime(row[0], '%Y-%m-%d')
high = int(row[1])
low = int(row[3])
except ValueError:
print(current_date, '错误数据')
else:
dates.append(current_date)
highs.append(high)
lows.append(low)
# 根据数据绘制图形
fig = plt.figure(dpi=128, figsize=(10, 6))
plt.plot(dates, highs, c='red')
plt.plot(dates, lows, c='blue')
# facecolor指定填充区域的颜色
plt.fill_between(dates, highs, lows, facecolor='blue', alpha=0.1)
# 设置图形的格式
title = "Daily high and low temperatures - 2014\nDeath Valley CA"
plt.title(title, fontsize=20)
plt.xlabel("", fontsize=16)
# 绘制斜的日期标签
fig.autofmt_xdate()
plt.ylabel("Temperature (F)", fontsize=16)
plt.tick_params(axis='both', which='major', labelsize=16)
plt.show()
提取文件的数据生成可视化图表:
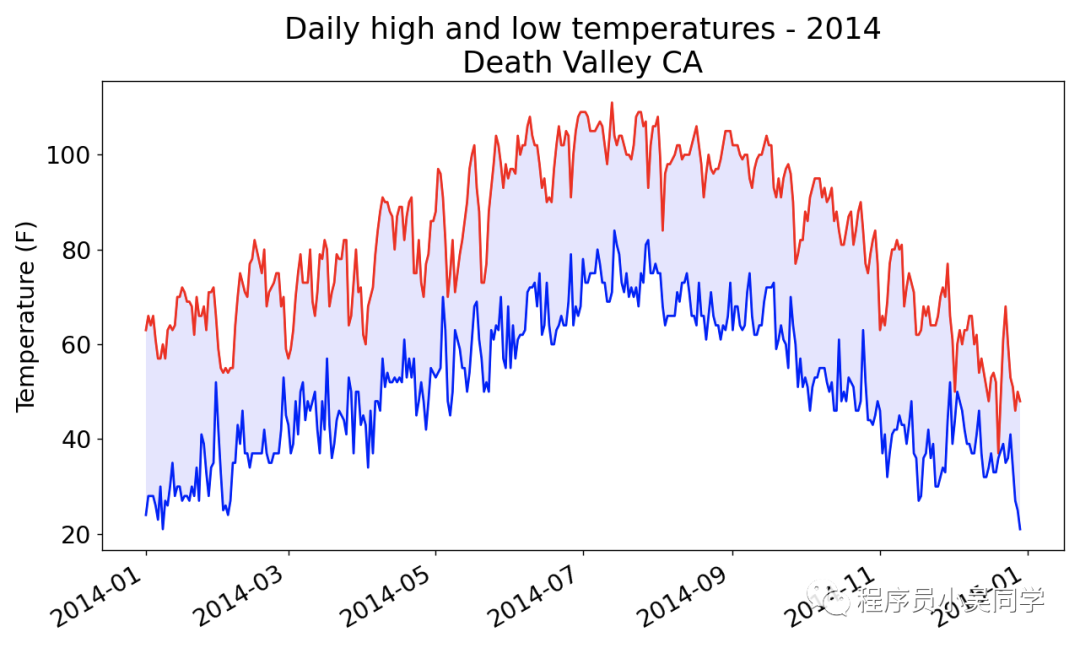
deathvalley2014.csv 这个文件中有一行数据是 2014-2-16,,,,,,,,,,,,,,,,,,,0.00,,,-1如果不进行错误检查会报错, 代码中我们使用try-except-else来处理了这种问题:
try:
current_date = datetime.strptime(row[0], '%Y-%m-%d')
high = int(row[1])
low = int(row[3])
except ValueError:
print(current_date, '错误数据')
else:
dates.append(current_date)
highs.append(high)
lows.append(low)
只会在控制台打印 2014-02-1600:00:00错误数据, 不影响可视化图表的生成.
参考
代码:highslows.py
highslows2.py
highs_lows3.py
文件:sitkaweather07-2014.csv
sitkaweather2014.csv
deathvalley2014.csv


 109
109


 被折叠的 条评论
为什么被折叠?
被折叠的 条评论
为什么被折叠?
 到【灌水乐园】发言


